

SEI/USDT Perpetual · Binance · 15-Minute Chart · August 24, 2026
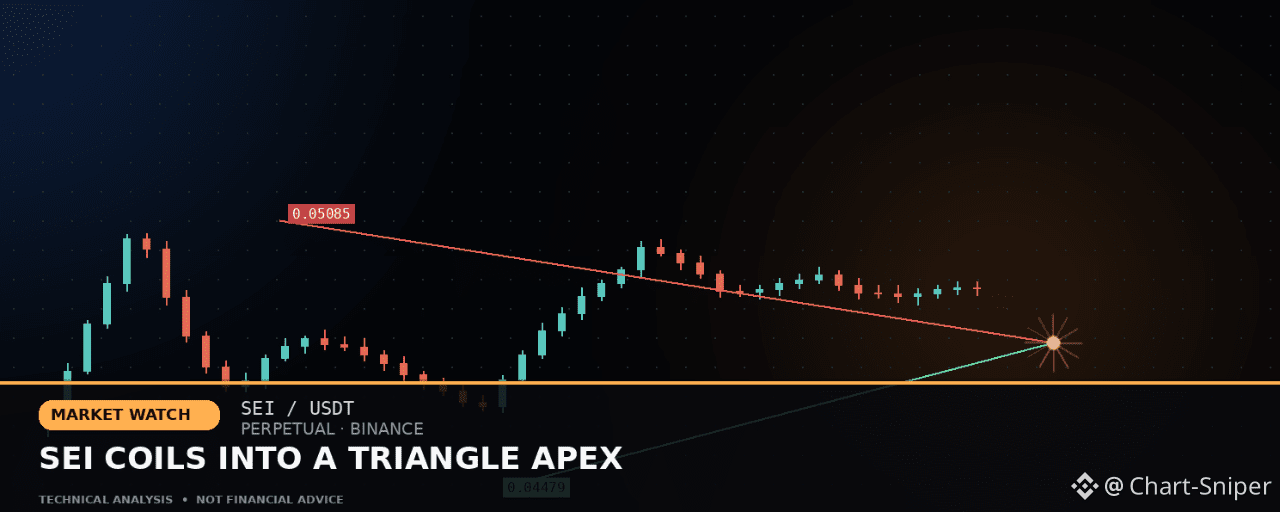
SEI has spent the last few days winding down into a textbook symmetrical squeeze — a series of lower highs stacked against a series of higher lows, compressing the range tighter and tighter as it approaches the apex of the pattern. Coiling patterns like this rarely resolve quietly; they tend to release with a sharp, decisive move once one side of the range finally gives way. Here's how the structure has developed and where the trigger levels sit.
The Structure So Far
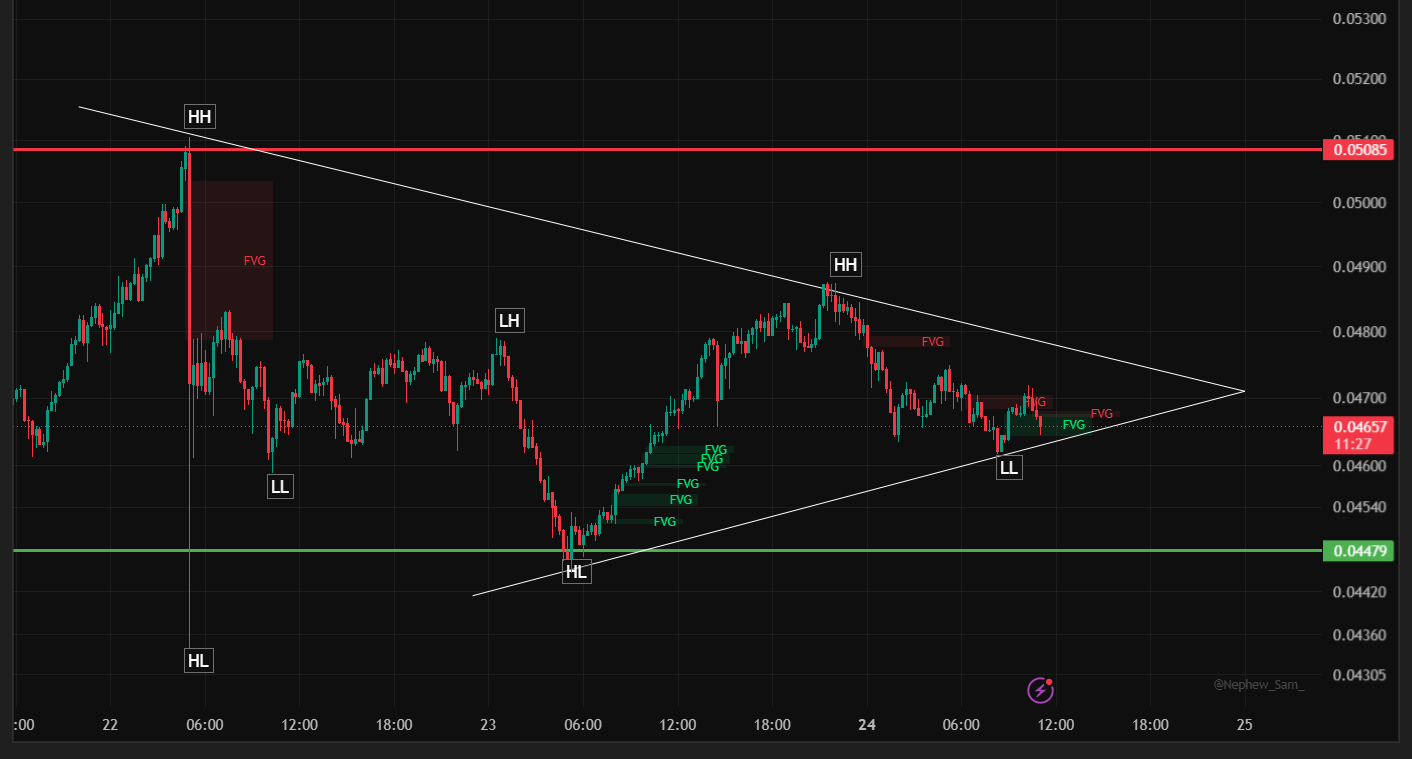
The move opened with an impulsive rally into the higher high (HH) at 0.05085, the dominant high on the chart and the anchor for the descending trendline that has capped every rally since.
That high was followed by a sharp higher low (HL) flush and a subsequent lower low (LL) near 0.0463, before a modest bounce into a lower high (LH) around 0.0478.
Price then rolled over again into a second HL near 0.0450, sitting just above the major support at 0.04479 — the level that now anchors the ascending trendline on the other side of the triangle.
From that HL, SEI rallied into a second, lower HH around 0.0490, confirming the descending resistance line and completing the triangle's upper boundary.
Since that second high, price has eased back into a tightening consolidation through a stack of Fair Value Gaps, and is now trading around 0.04671, right in the middle of the narrowing range as it approaches the triangle's apex.
Key Levels to Watch
Resistance:
The descending trendline, currently converging down from the 0.0508 and 0.0490 highs — this is the immediate ceiling that needs to break for any bullish resolution.
0.05085 — the major swing high (HH) and the ultimate resistance level if the triangle resolves upward.
Support:
The ascending trendline, rising up from the 0.0450 higher low — the immediate floor of the pattern.
0.04479 — the major structural support. A clean break below this would be the clearest bearish resolution of the triangle.
Trade Setups Worth Considering
1. Bullish Breakout Long
Entry: On a confirmed 15-minute close above the descending trendline (currently tracking just above the current price, roughly the 0.0472–0.0475 area), ideally with a retest holding as new support.
Target: First target at the 0.0490 prior high, with an extended target at the major 0.05085 resistance.
Stop-loss: Below 0.04600, which would suggest a false breakout back into the range.
2. Bearish Breakdown Short
Entry: On a confirmed 15-minute close below the ascending trendline and the 0.04479 support.
Target: A measured move down toward 0.0420–0.0430, based on the height of the triangle pattern.
Stop-loss: Above 0.04550, which would suggest the breakdown has failed.
3. Range-Fade Approach (higher risk near the apex)
Entry: Buying dips toward the ascending support line, or fading rallies into the descending resistance line, while the triangle is still intact.
Target: The opposite side of the narrowing range.
Stop-loss: A clean break of either trendline, since range trades stop working once the pattern resolves.
The Bottom Line
Triangles like this are a classic pre-expansion setup — the tighter the coil, the more forceful the eventual move tends to be. With price now trading right at the midpoint of the pattern, the smart approach is to wait for a decisive close beyond either the descending resistance or the 0.04479 support rather than guessing the direction in advance. A break above the trendline favors a run back toward 0.0490–0.05085; a break below 0.04479 instead opens the door to a deeper move toward the low-0.04s.
Disclaimer: This article is for informational and educational purposes only and does not constitute financial, investment, or trading advice. Cryptocurrency derivatives, including perpetual contracts, are highly volatile and leveraged instruments that carry a significant risk of loss. Always conduct your own research and risk management, and consider consulting a licensed financial advisor before making any trading decisions.
@Binance Square Official #SP500FuturesFall #BrentDrops1.87% #SamsungFalls8.97%DraggingKospiDown3.24% #Binance #ChartSniper