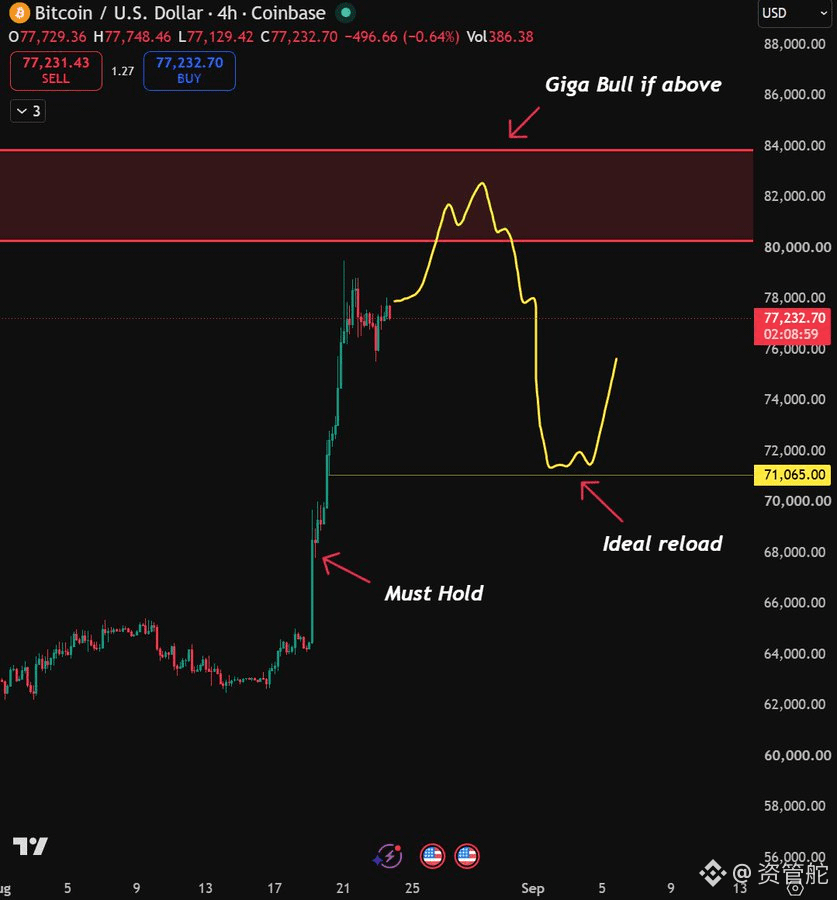
BTC This 4H chart clearly marks the key levels—let’s go through it.
Right now, the price is around 77,200. Earlier, it surged from 62,000 to 83,000, then pulled back to around 71,000 and started bouncing.
There are three spots on the chart worth watching:
1) 80,000–84,000 — this red zone is labeled “Giga Bull if above.” In simple terms: as long as price effectively holds above 80k, the upside opens up, and a trend-following bullish move is confirmed. Until it’s above, this area remains strong resistance.
2) Around 71,000 — marked “Ideal reload.” If the pullback reaches here without breaking below, it’s a good spot to add positions. From the chart, the previous pullback stabilized exactly in this area and rebounded, which suggests the market recognizes this support.
3) 66,000 — labeled “Must Hold.” This is the last line of defense for bulls. If price breaks below 66,000, then the prior upswing structure from 62,000 to 83,000 is damaged, and everything needs to be reassessed.
Current price is 77,200—positioned slightly above the middle of the 71,000 to 80,000 range. When price is neither here nor there, it tests patience the most. Either wait for a breakout above 80k with volume, then chase; or wait for a retest to 71,000, then enter. Both have logic—choose based on your position size and risk preference.
Volume is 386, not particularly large. To break through the 80k level, you’d need to see a clear and noticeable expansion in volume. If it pushes up on low volume, it’s more likely a false breakout.
Right now, the price is around 77,200. Earlier, it surged from 62,000 to 83,000, then pulled back to around 71,000 and started bouncing.
There are three spots on the chart worth watching:
1) 80,000–84,000 — this red zone is labeled “Giga Bull if above.” In simple terms: as long as price effectively holds above 80k, the upside opens up, and a trend-following bullish move is confirmed. Until it’s above, this area remains strong resistance.
2) Around 71,000 — marked “Ideal reload.” If the pullback reaches here without breaking below, it’s a good spot to add positions. From the chart, the previous pullback stabilized exactly in this area and rebounded, which suggests the market recognizes this support.
3) 66,000 — labeled “Must Hold.” This is the last line of defense for bulls. If price breaks below 66,000, then the prior upswing structure from 62,000 to 83,000 is damaged, and everything needs to be reassessed.
Current price is 77,200—positioned slightly above the middle of the 71,000 to 80,000 range. When price is neither here nor there, it tests patience the most. Either wait for a breakout above 80k with volume, then chase; or wait for a retest to 71,000, then enter. Both have logic—choose based on your position size and risk preference.
Volume is 386, not particularly large. To break through the 80k level, you’d need to see a clear and noticeable expansion in volume. If it pushes up on low volume, it’s more likely a false breakout.