$ZEC 4 Hourly Chart Analysis: High-Level Consolidation and Key Levels to Watch
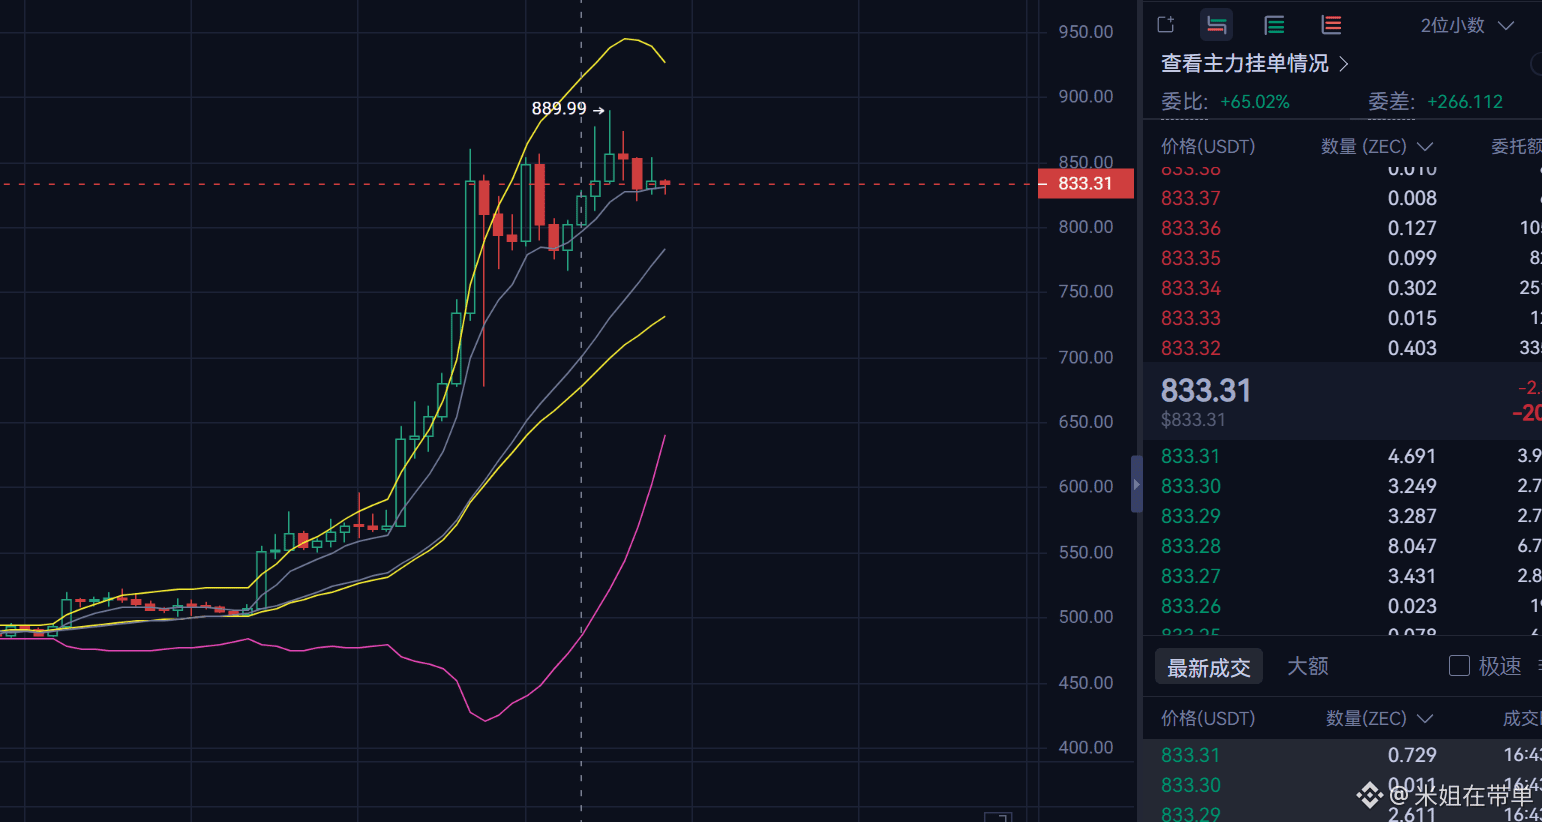
ZEC is currently trading around 832. After a previous quick surge, it reached a high of 889.99, then moved into a phase of high-level consolidation.
From the 4-hour chart, although the price has pulled back from the peak, it is still running above the mid-term moving averages overall, indicating that the uptrend has not been broken for now. However, after a series of short-term upward pushes, momentum has somewhat slowed. Recently, several candlesticks have clearly shown sideways movement at high levels, and the resistance in the 850–860 area is quite prominent.
On the downside, the key area to watch is 820–830. This is currently the most crucial support zone for the short term. As long as the price can hold steady around 830 and then reclaim the level above 850, there is still a chance to retest the previous high zone at 880–890.
If the 830 support is clearly broken, the short-term structure will weaken, and you can further look at the 800–810 area for support.
Mi Jie’s personal view: At the moment, ZEC is better suited to watching for breakouts and pullbacks at key levels. It’s not advisable to chase longs blindly around 830. For the short term, focus on 830 support and 850 resistance. If price holds above 850, then look for upside room; if it breaks below 830, be prepared for further pullback risk.
Overall, ZEC is currently in a high-level consolidation and accumulation phase. The choice within the 830–850 range will be an important direction for the upcoming short-term market.
#标普500期货下跌 #布伦特原油跌1.87%
ZEC is currently trading around 832. After a previous quick surge, it reached a high of 889.99, then moved into a phase of high-level consolidation.
From the 4-hour chart, although the price has pulled back from the peak, it is still running above the mid-term moving averages overall, indicating that the uptrend has not been broken for now. However, after a series of short-term upward pushes, momentum has somewhat slowed. Recently, several candlesticks have clearly shown sideways movement at high levels, and the resistance in the 850–860 area is quite prominent.
On the downside, the key area to watch is 820–830. This is currently the most crucial support zone for the short term. As long as the price can hold steady around 830 and then reclaim the level above 850, there is still a chance to retest the previous high zone at 880–890.
If the 830 support is clearly broken, the short-term structure will weaken, and you can further look at the 800–810 area for support.
Mi Jie’s personal view: At the moment, ZEC is better suited to watching for breakouts and pullbacks at key levels. It’s not advisable to chase longs blindly around 830. For the short term, focus on 830 support and 850 resistance. If price holds above 850, then look for upside room; if it breaks below 830, be prepared for further pullback risk.
Overall, ZEC is currently in a high-level consolidation and accumulation phase. The choice within the 830–850 range will be an important direction for the upcoming short-term market.
#标普500期货下跌 #布伦特原油跌1.87%