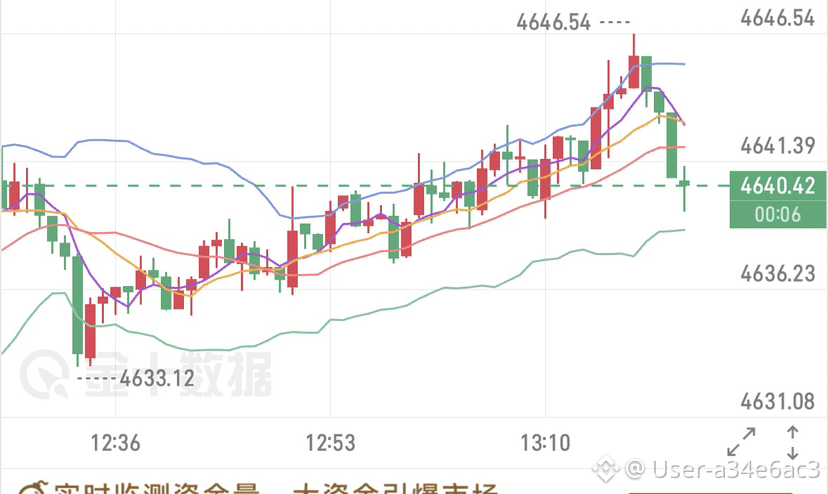
8.24 Gold Midday Strategy
On the hourly chart, the Bollinger Bands are opening upward. Gold price is moving higher while leaning on the Bollinger Bands, and the short-term bullish structure remains intact. However, after a continuous round of rebounds, the RSI and KDJ indicators have already moved into the overbought zone, and the MACD histogram red bars are gradually shrinking. The momentum for pushing higher in the short term is showing clear signs of weakening. With bullish profit-taking accumulated from longs entered at earlier low levels, sell pressure at higher levels is gradually becoming apparent. There is an intrinsic need for a technical pullback and correction on the chart. The market has shifted into a strong but choppy consolidation pattern, and chasing the price directly at this stage carries a relatively high risk.
Key Levels
Resistance: 4655, 4670
Support: 4610, 4580
Trading Plan
If price stabilizes in the 4605-4625 range on the pullback, enter cautiously. Targets: 4650. After a breakout, look for 4670, then 4700.
(Personal advice only for reference—always remember to set stop-loss and manage risk properly.)
#布伦特原油跌1.87%
On the hourly chart, the Bollinger Bands are opening upward. Gold price is moving higher while leaning on the Bollinger Bands, and the short-term bullish structure remains intact. However, after a continuous round of rebounds, the RSI and KDJ indicators have already moved into the overbought zone, and the MACD histogram red bars are gradually shrinking. The momentum for pushing higher in the short term is showing clear signs of weakening. With bullish profit-taking accumulated from longs entered at earlier low levels, sell pressure at higher levels is gradually becoming apparent. There is an intrinsic need for a technical pullback and correction on the chart. The market has shifted into a strong but choppy consolidation pattern, and chasing the price directly at this stage carries a relatively high risk.
Key Levels
Resistance: 4655, 4670
Support: 4610, 4580
Trading Plan
If price stabilizes in the 4605-4625 range on the pullback, enter cautiously. Targets: 4650. After a breakout, look for 4670, then 4700.
(Personal advice only for reference—always remember to set stop-loss and manage risk properly.)
#布伦特原油跌1.87%