
📍Good morning dear friends! It no longer makes sense to review the analysis from last Friday, because I also understood that an upward move was taking place and I was waiting for a correction.
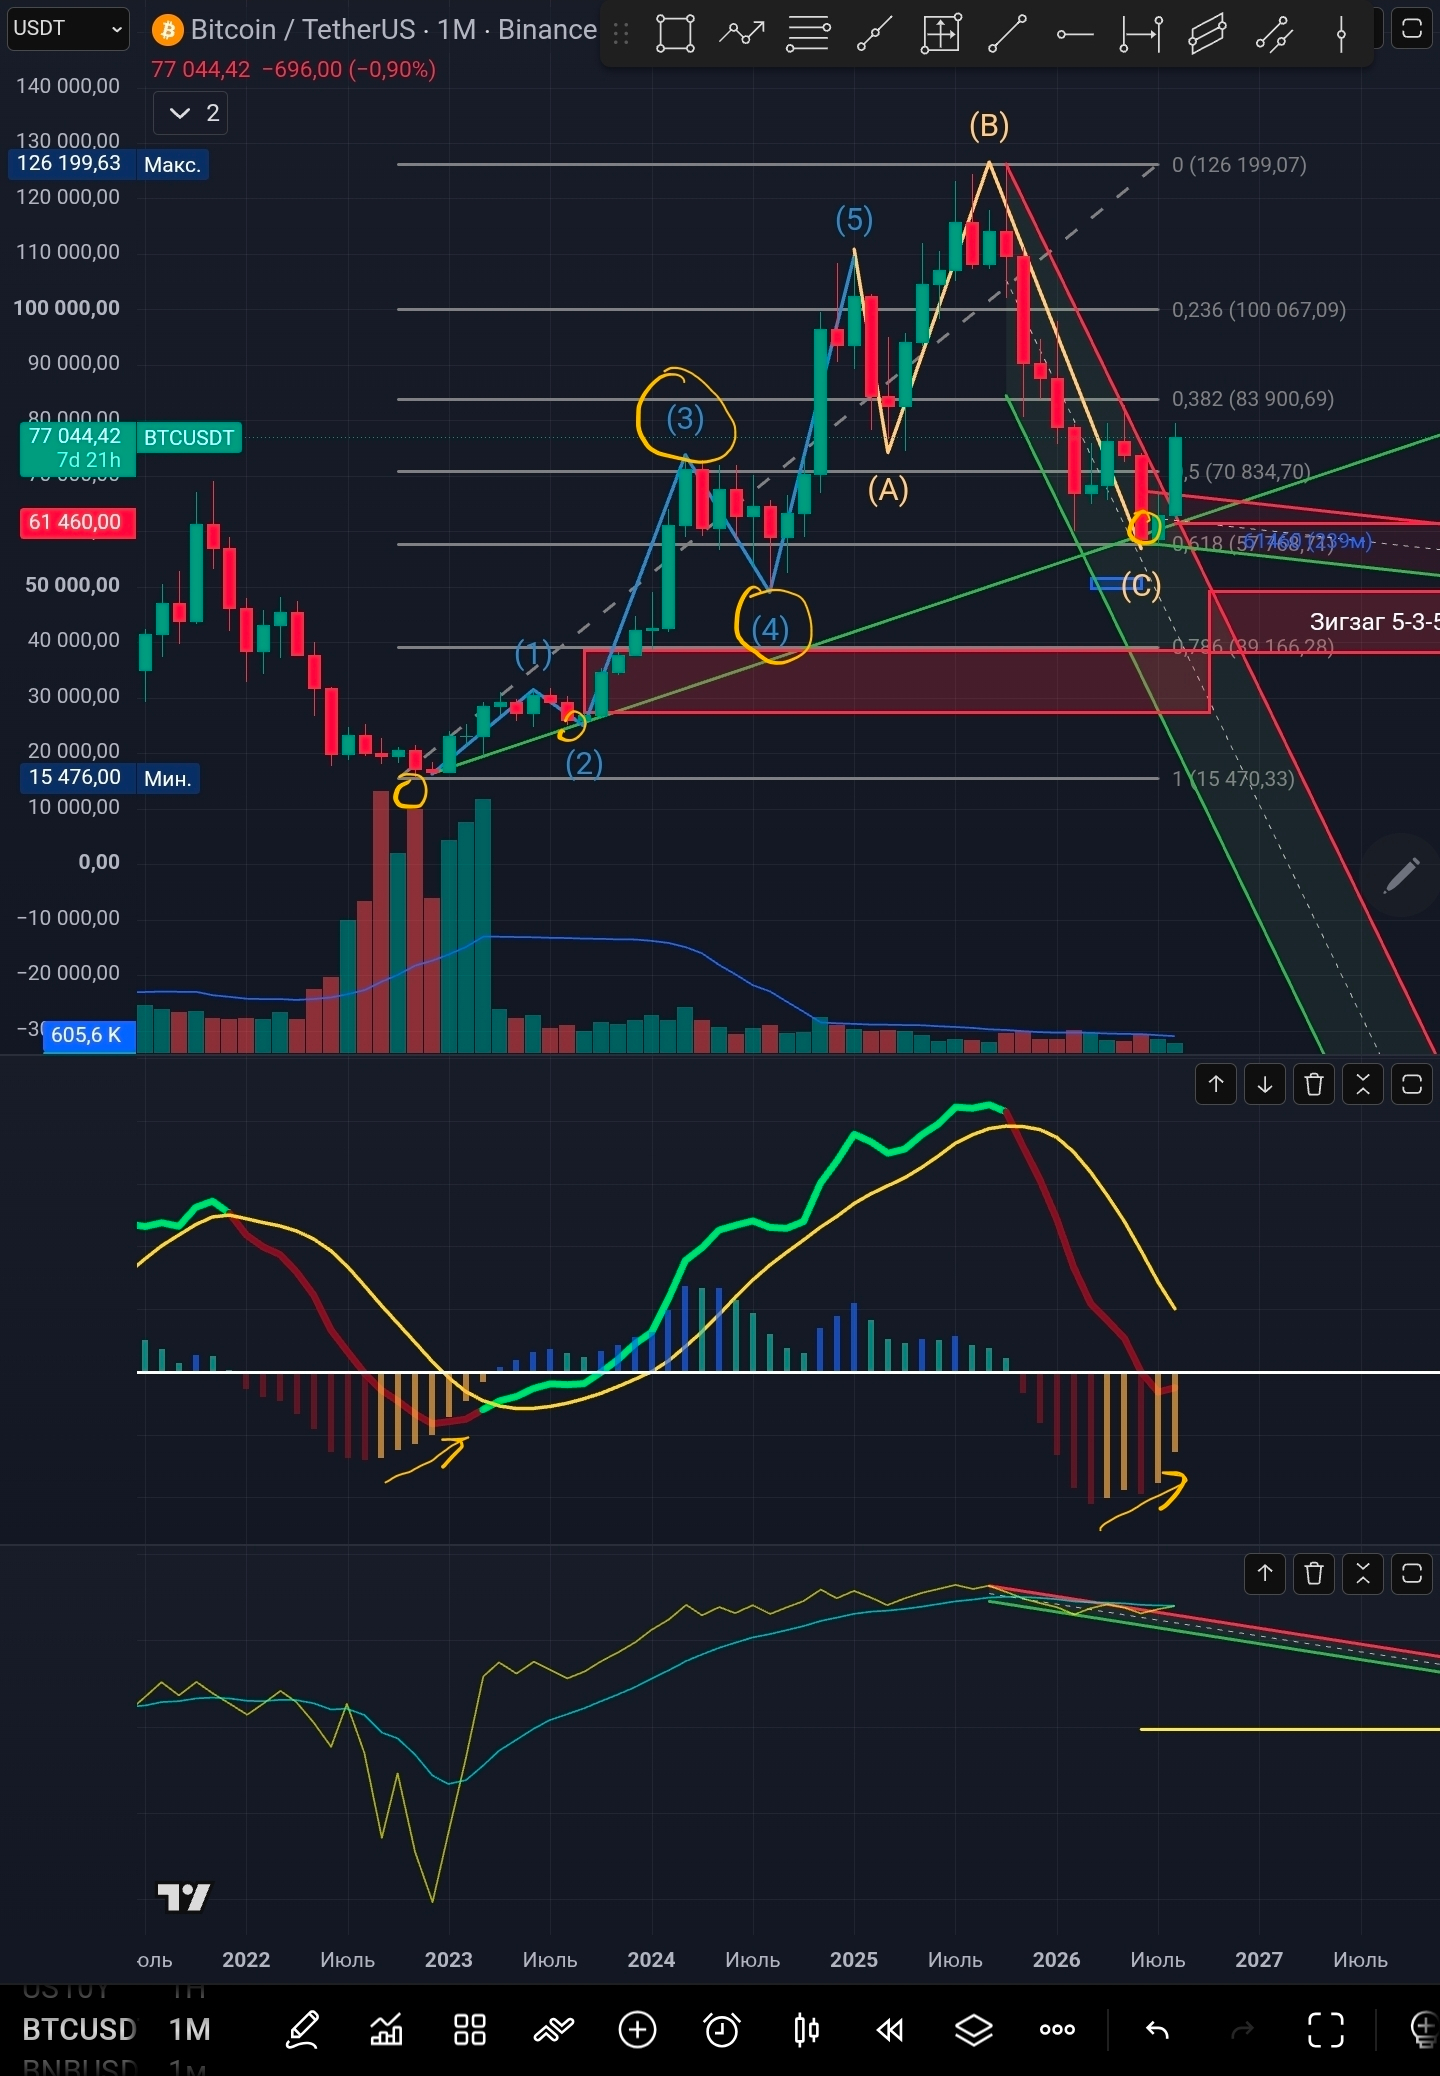
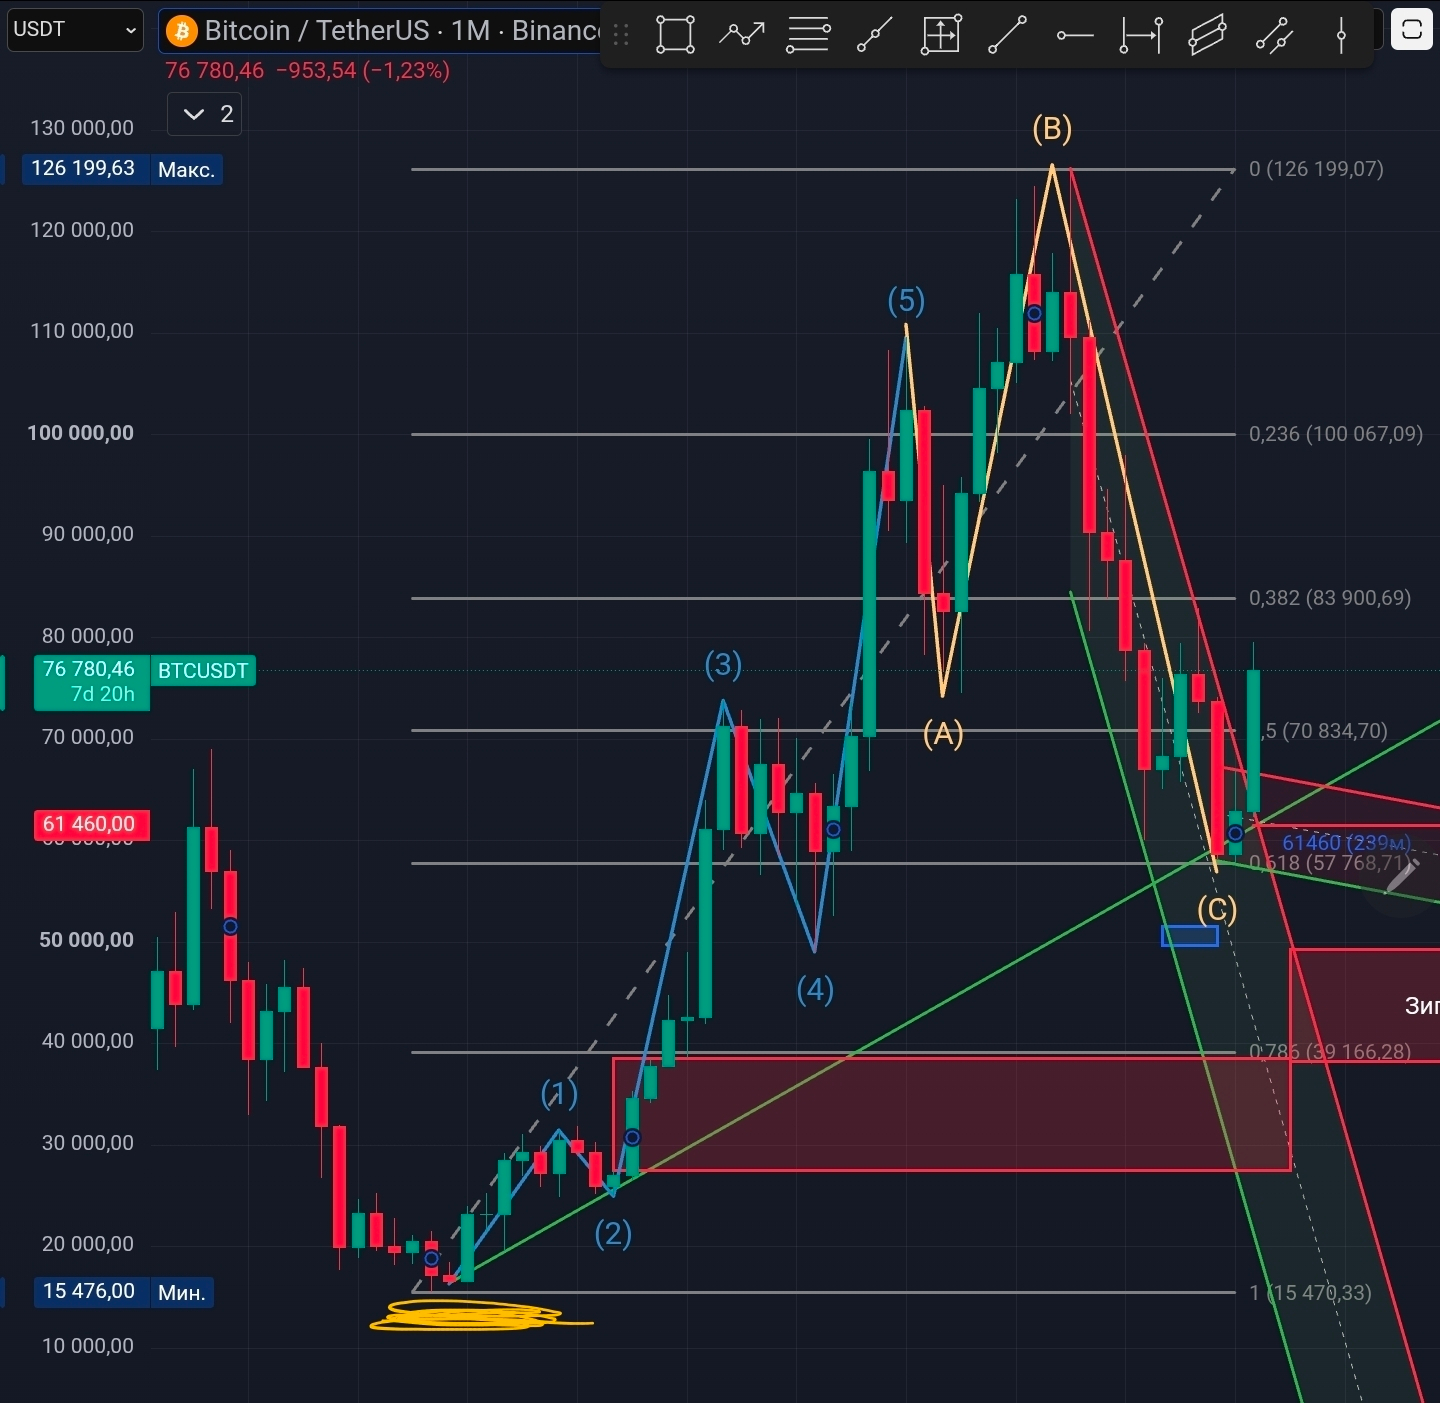
📍Let’s start with one-month candles. In this chart, we can see that the current price has tested the long-term support line of the uptrend. The MACD histogram began to take on an upward character; notice that the end of the bearish trend in the 22nd year occurred at exactly this moment. Another, and in my view the most important point of all this is the clear Elliott wave structure. According to Elliott’s theory, the end of a trend correction often falls within the range of wave four, (and we are exactly in that segment 3-4). Regarding this, Bitcoin is trading now the same way it once traded a long time ago, like gold did. I hope that in the coming days I’ll have enough time to record a video about this.
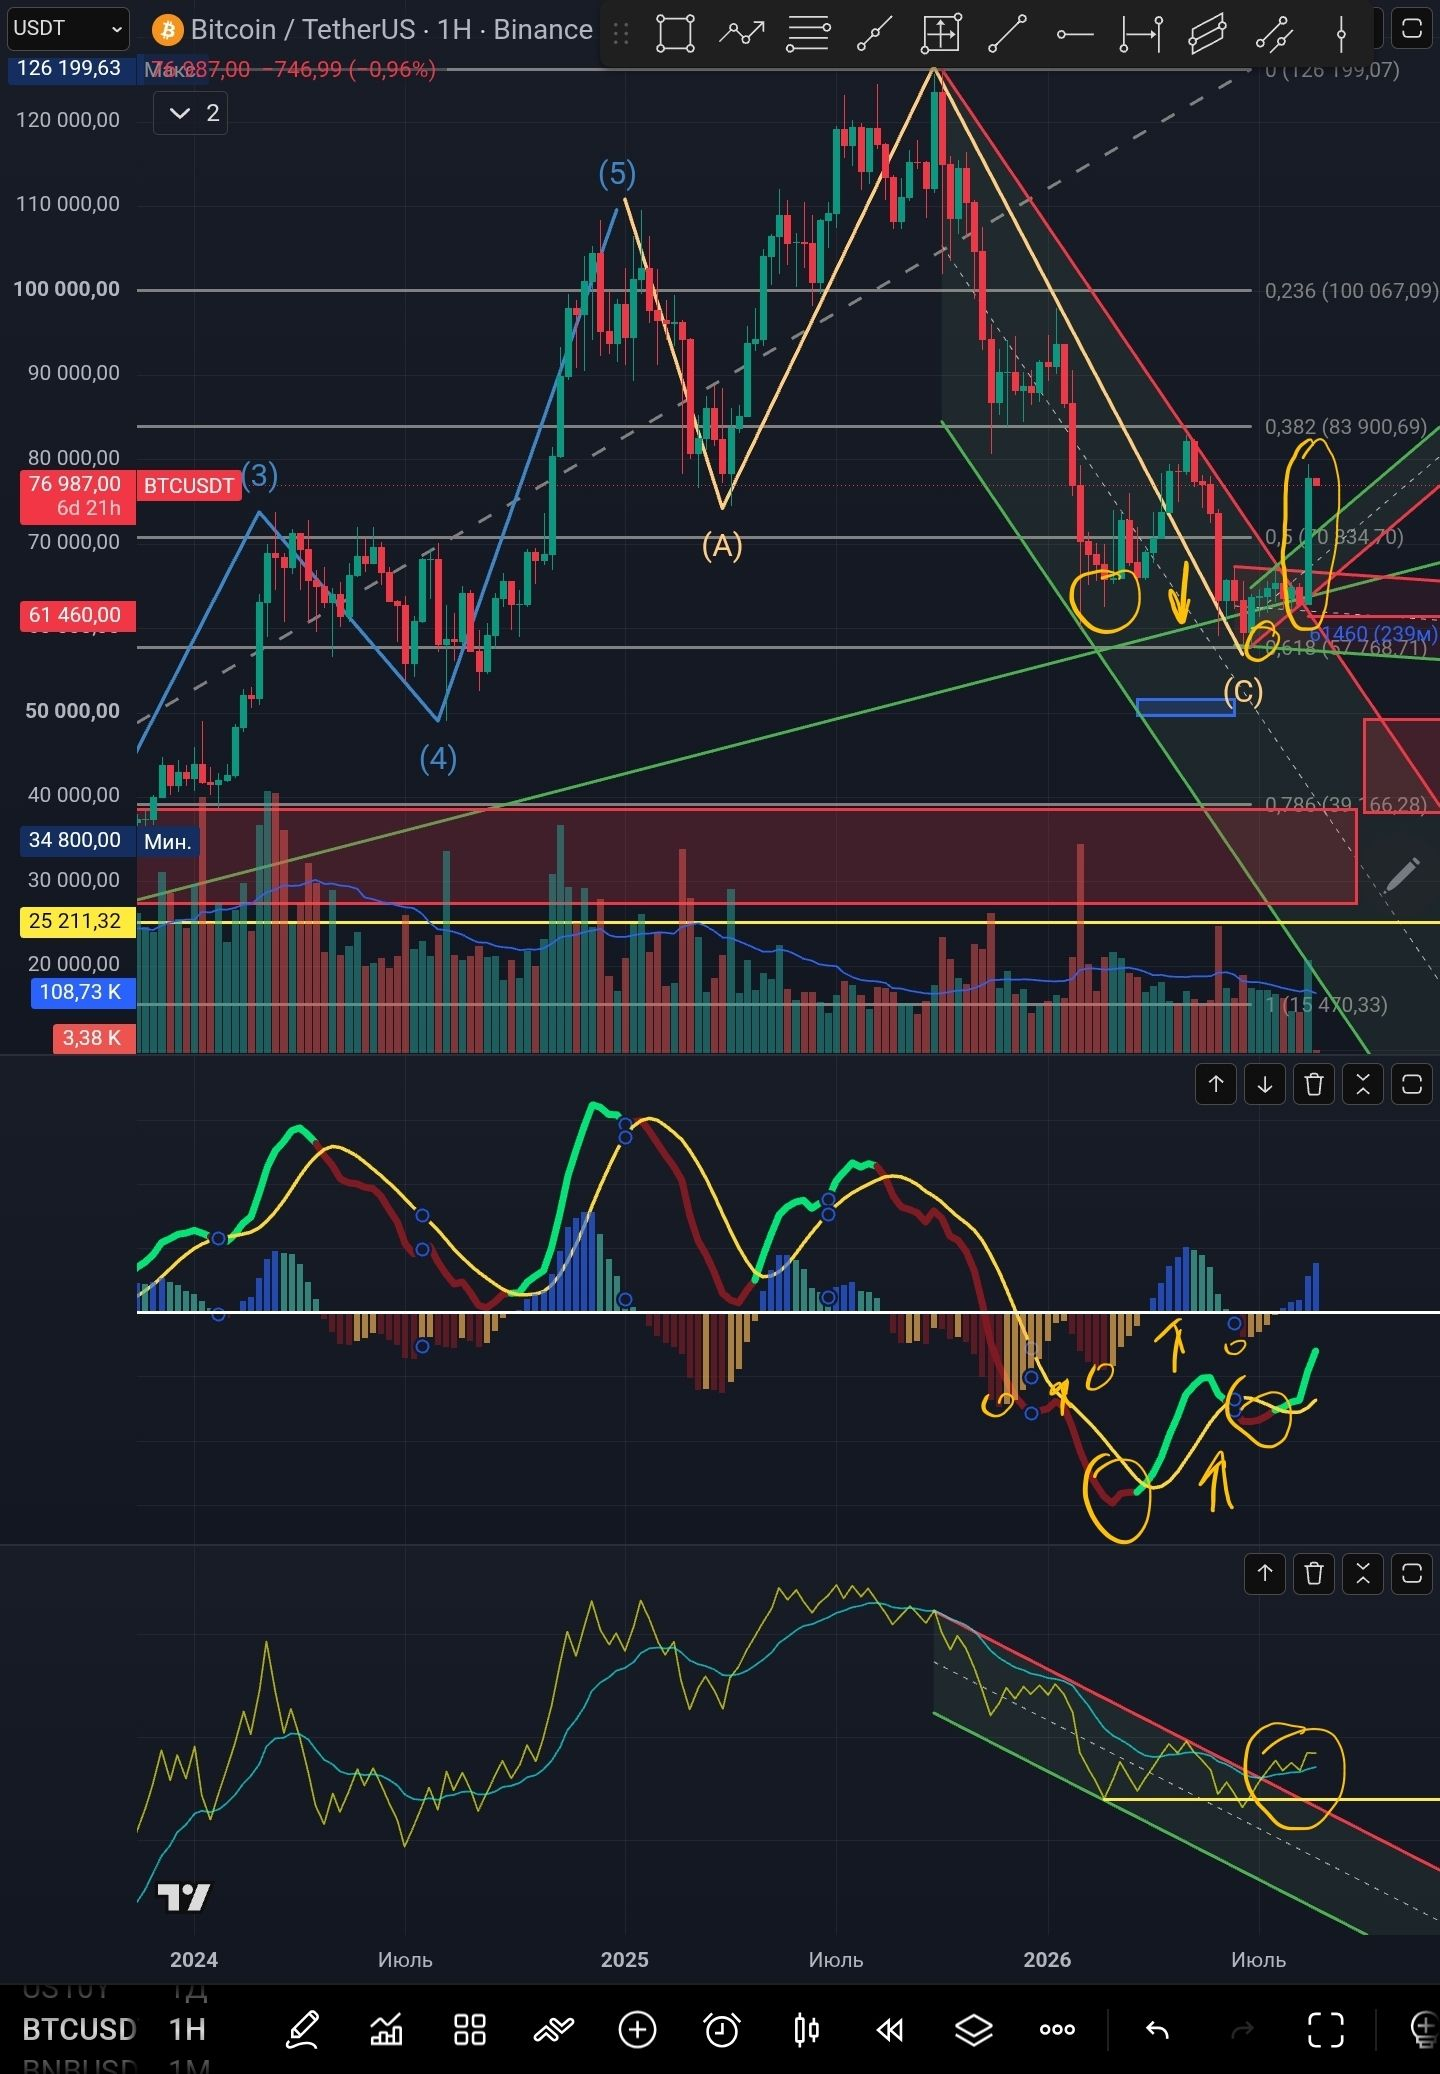
📍 On the weekly candles, we have an upward move on the indicators: MACD has a confident bullish divergence. One of the most positive signals is that the weekly candle acquired a very bullish character by closing near the very top of its price range, engulfing the previous 11-week decline.
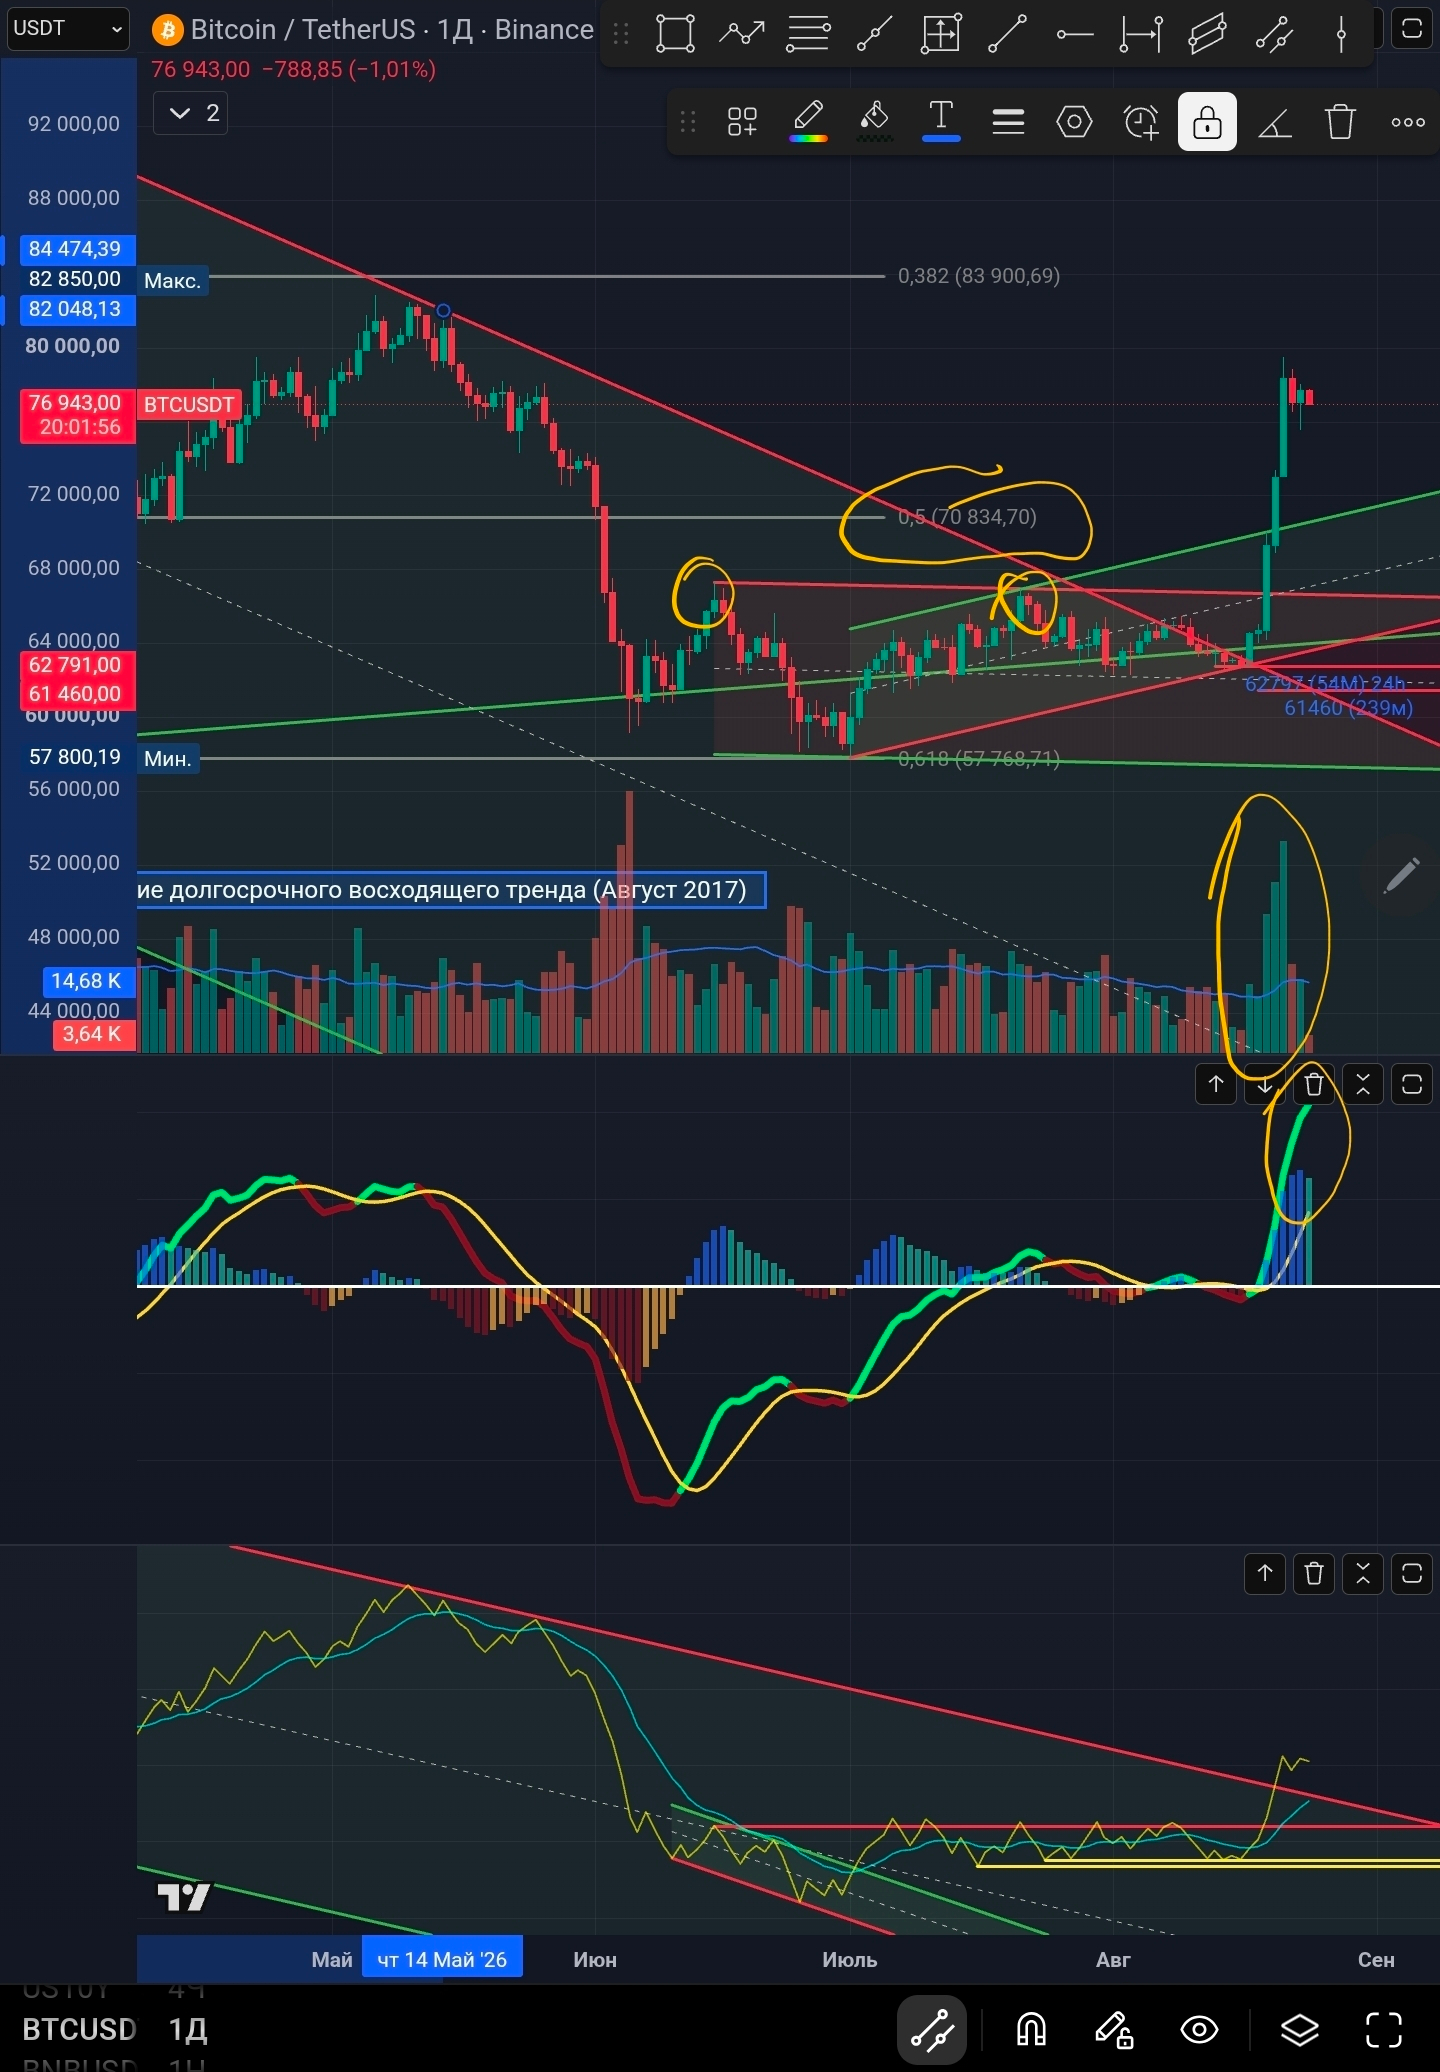
📍 On the daily candles, we have a strong confident breakout and consolidation on large volumes of a descending flag, an ascending channel, and the two previous highs. Both indicators show an upward trend.
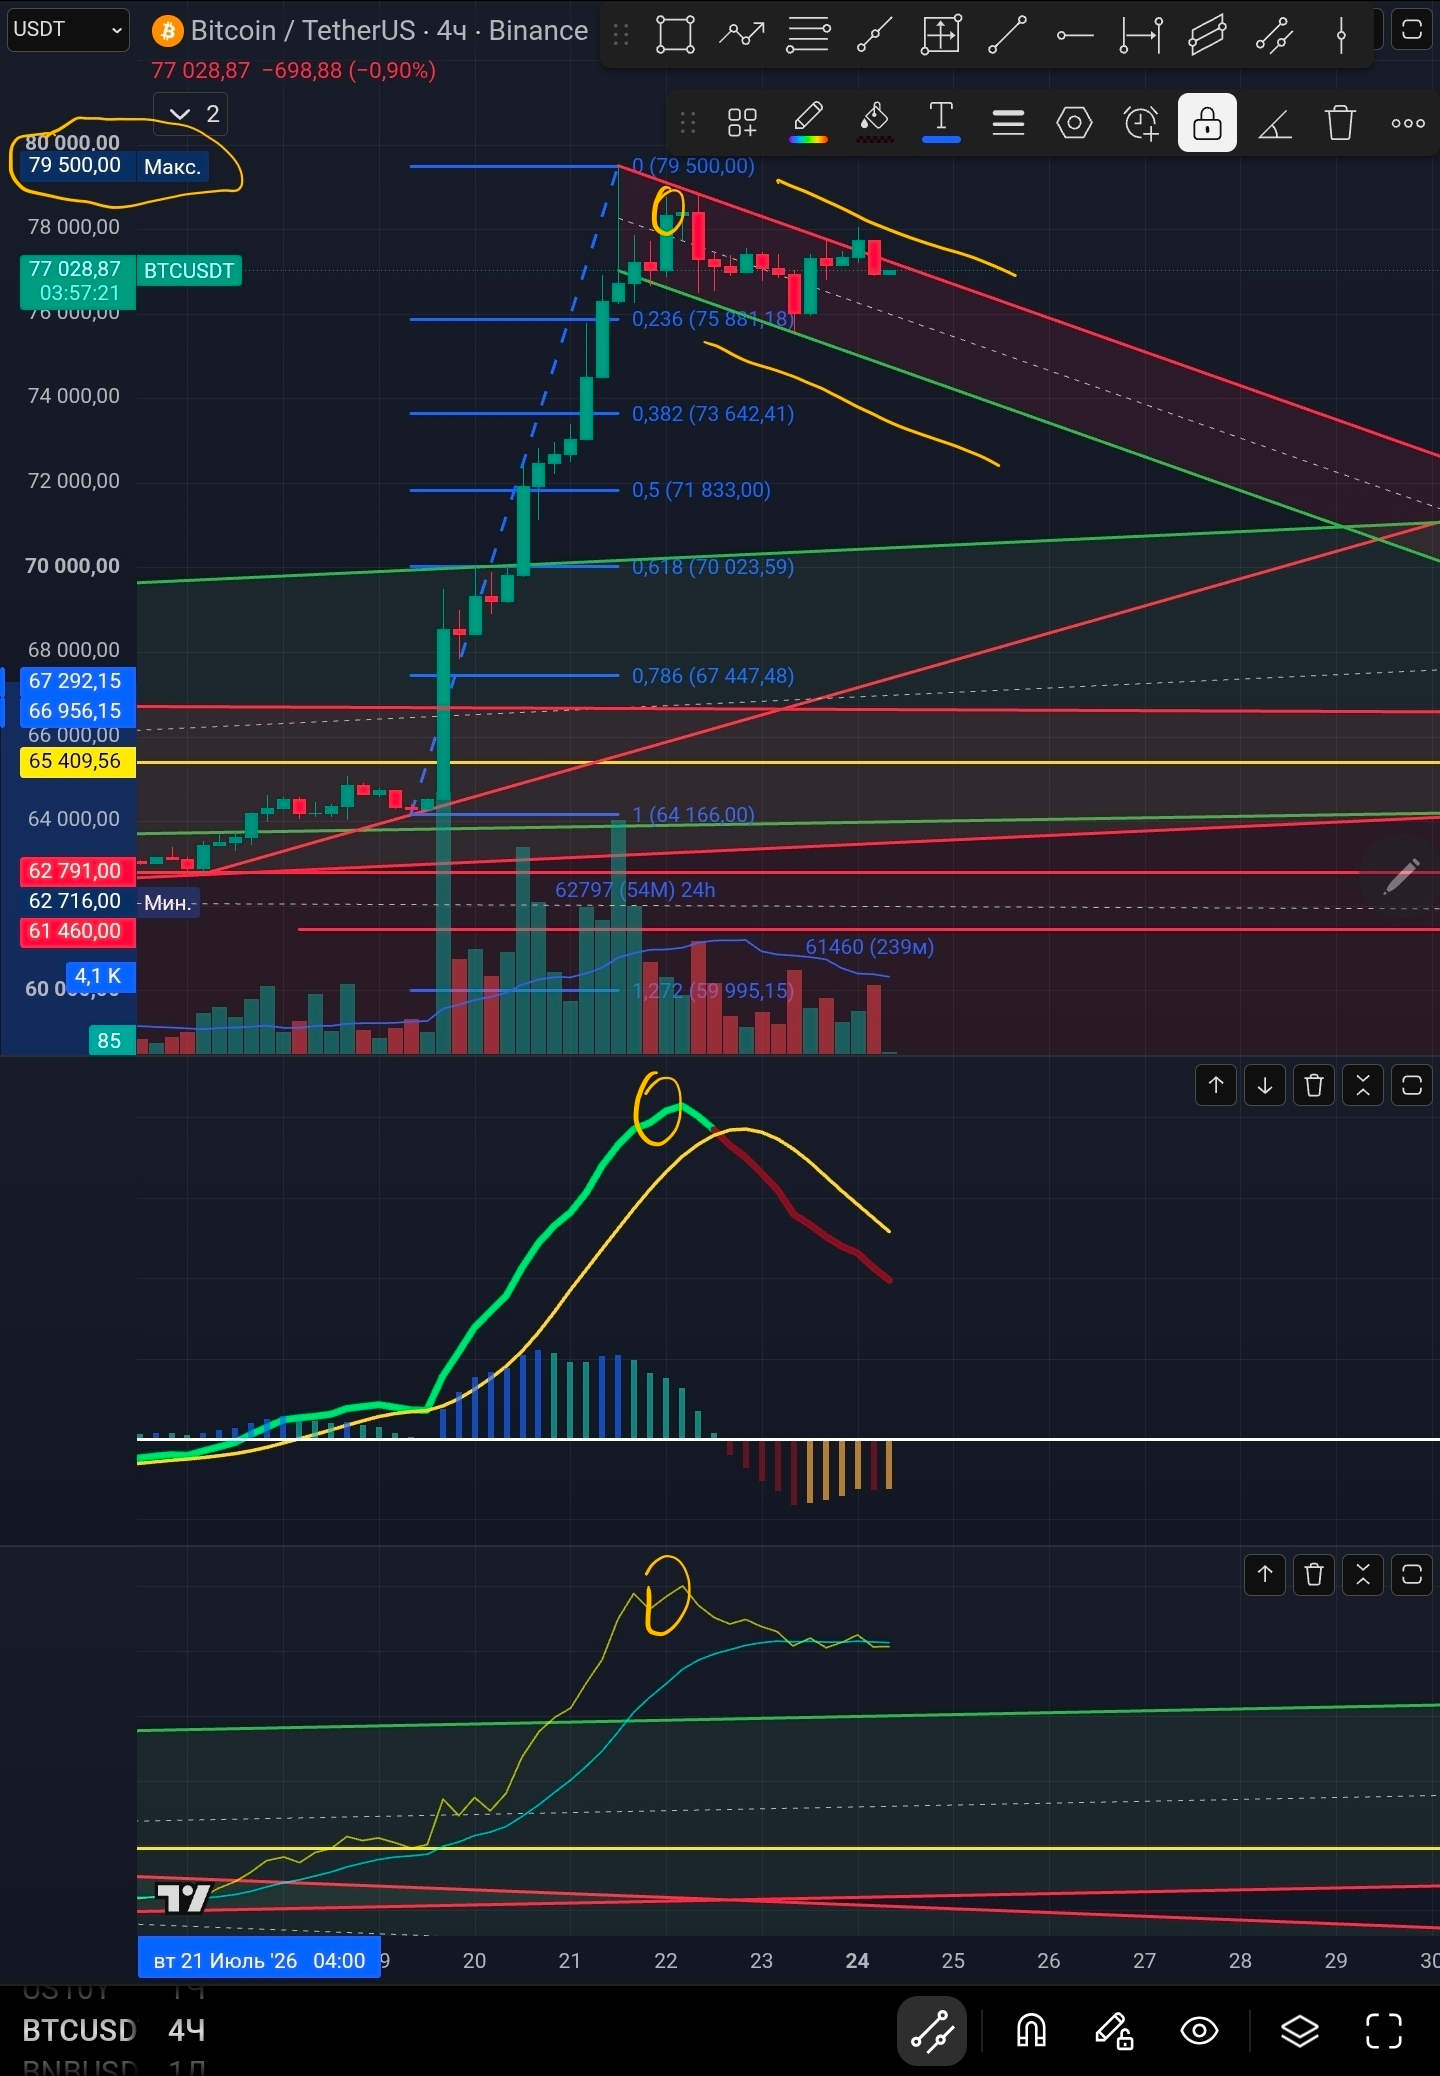
📍 On the four-hour candles, we see a characteristic stop to the move clearly at the 75500 mark. This is nothing other than a dead-cat bounce. The mechanics behind this move is called profit taking. It means that those who entered long got filled on Friday with their limit order at 75500 and didn’t wait for any negative news, leaving such a good profitable position to the mercy of the gods for Saturday and Sunday. I even thought about doing the same, but I will trust my calculations. Note that a certain descending channel has appeared, which will be better visible on lower timeframes.
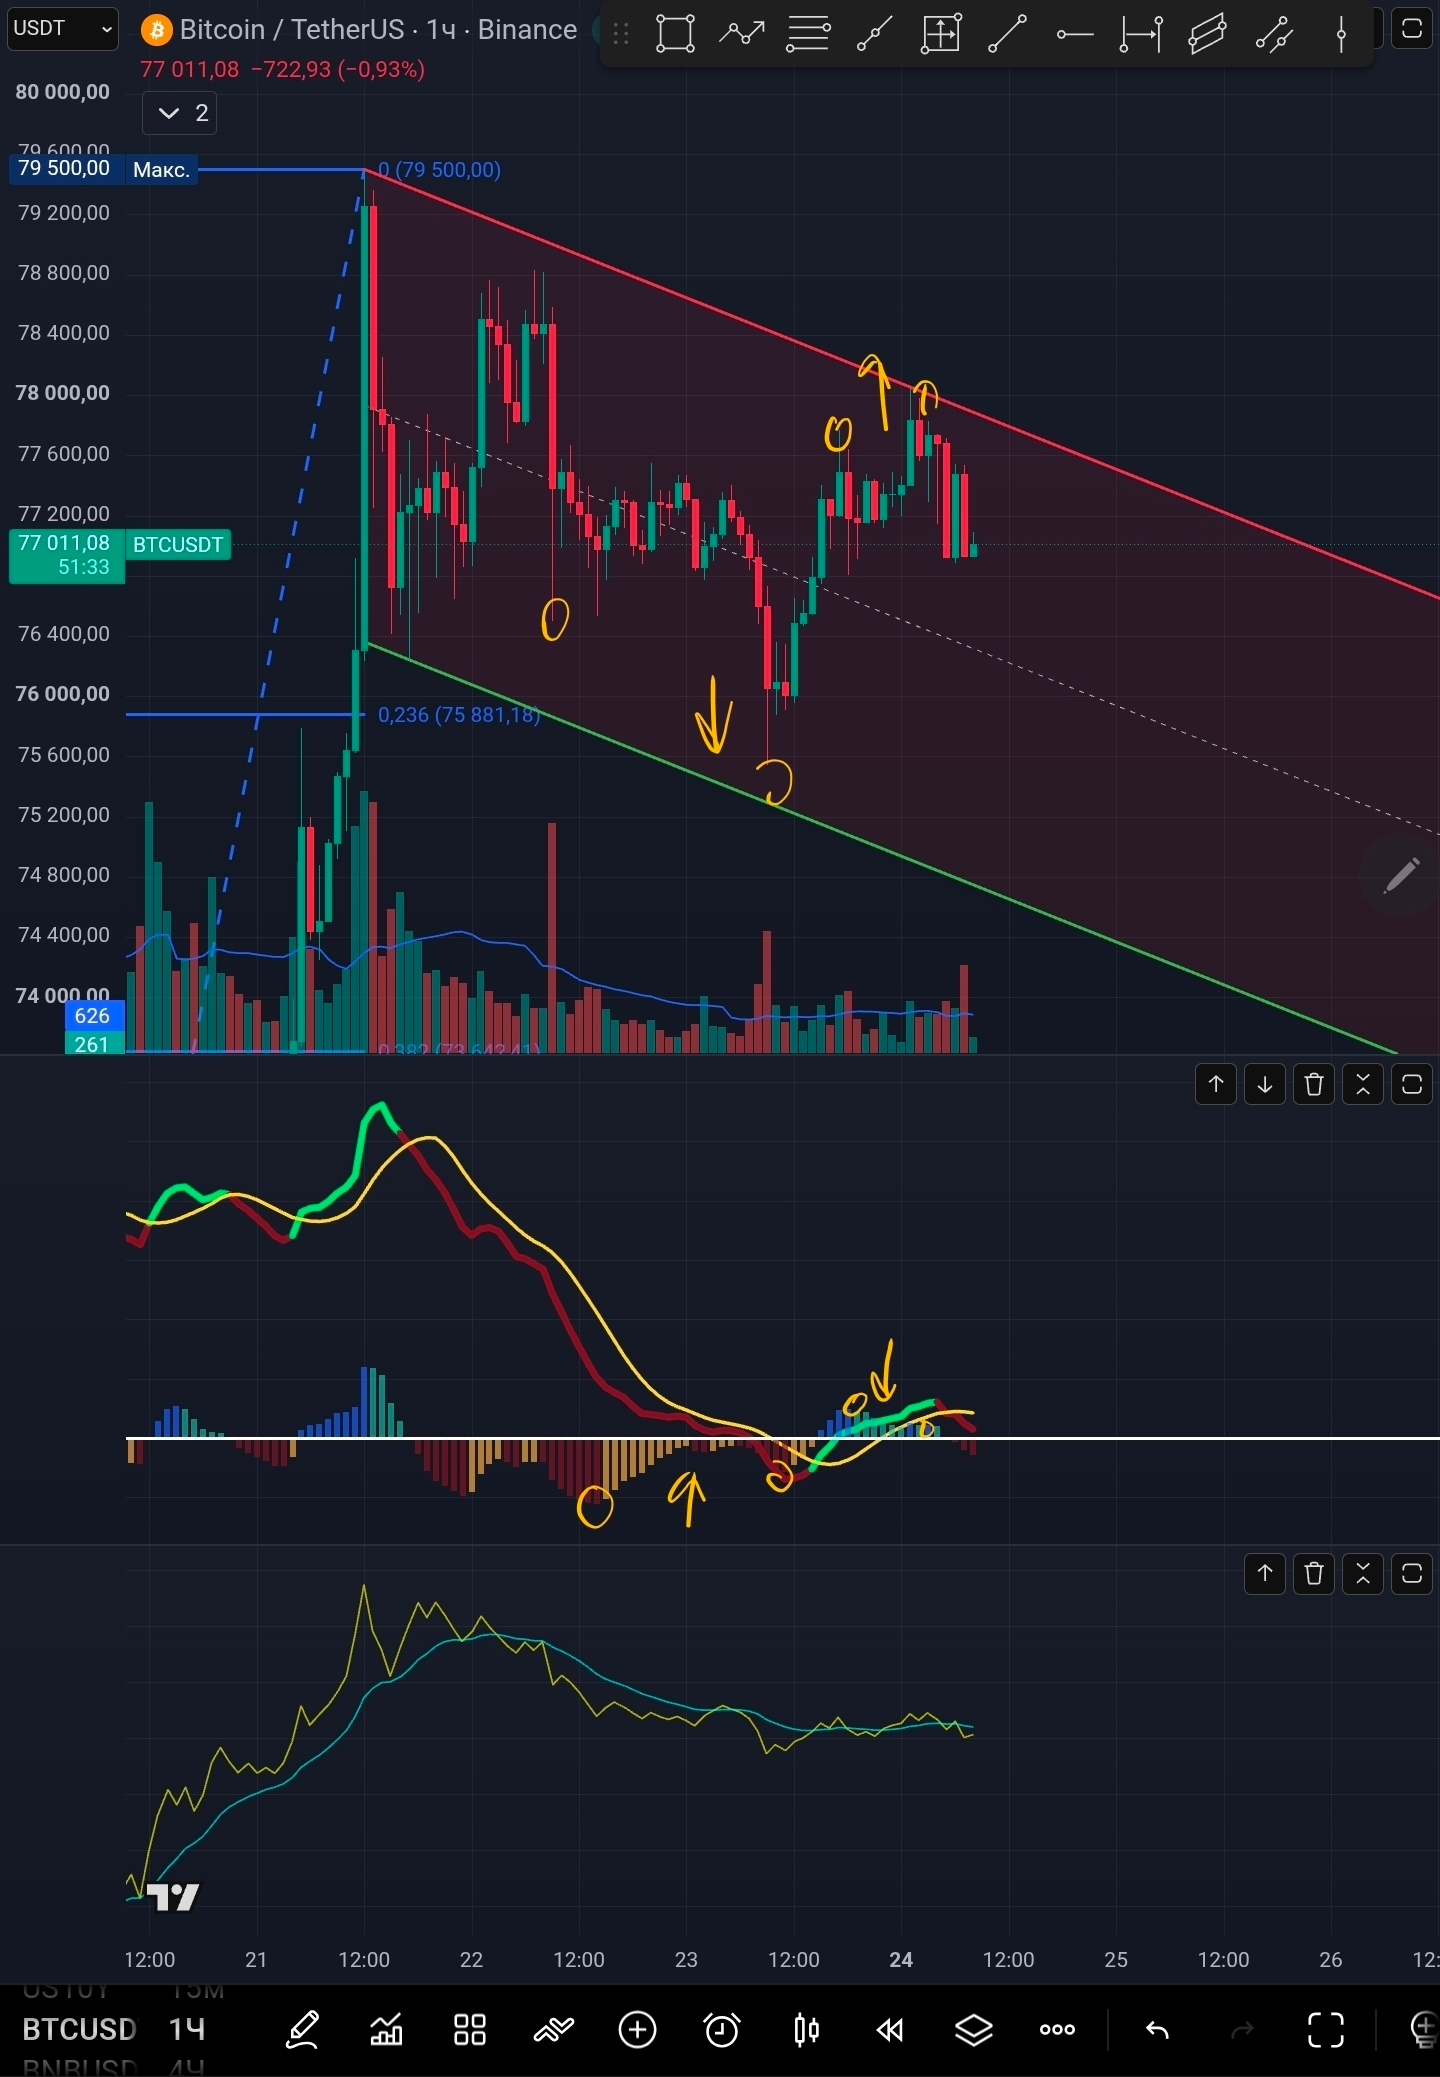
📍 On the hourly candles. The indicators give weak, mixed-direction signals, but mostly they simply follow the price. The sentiment is neutral.
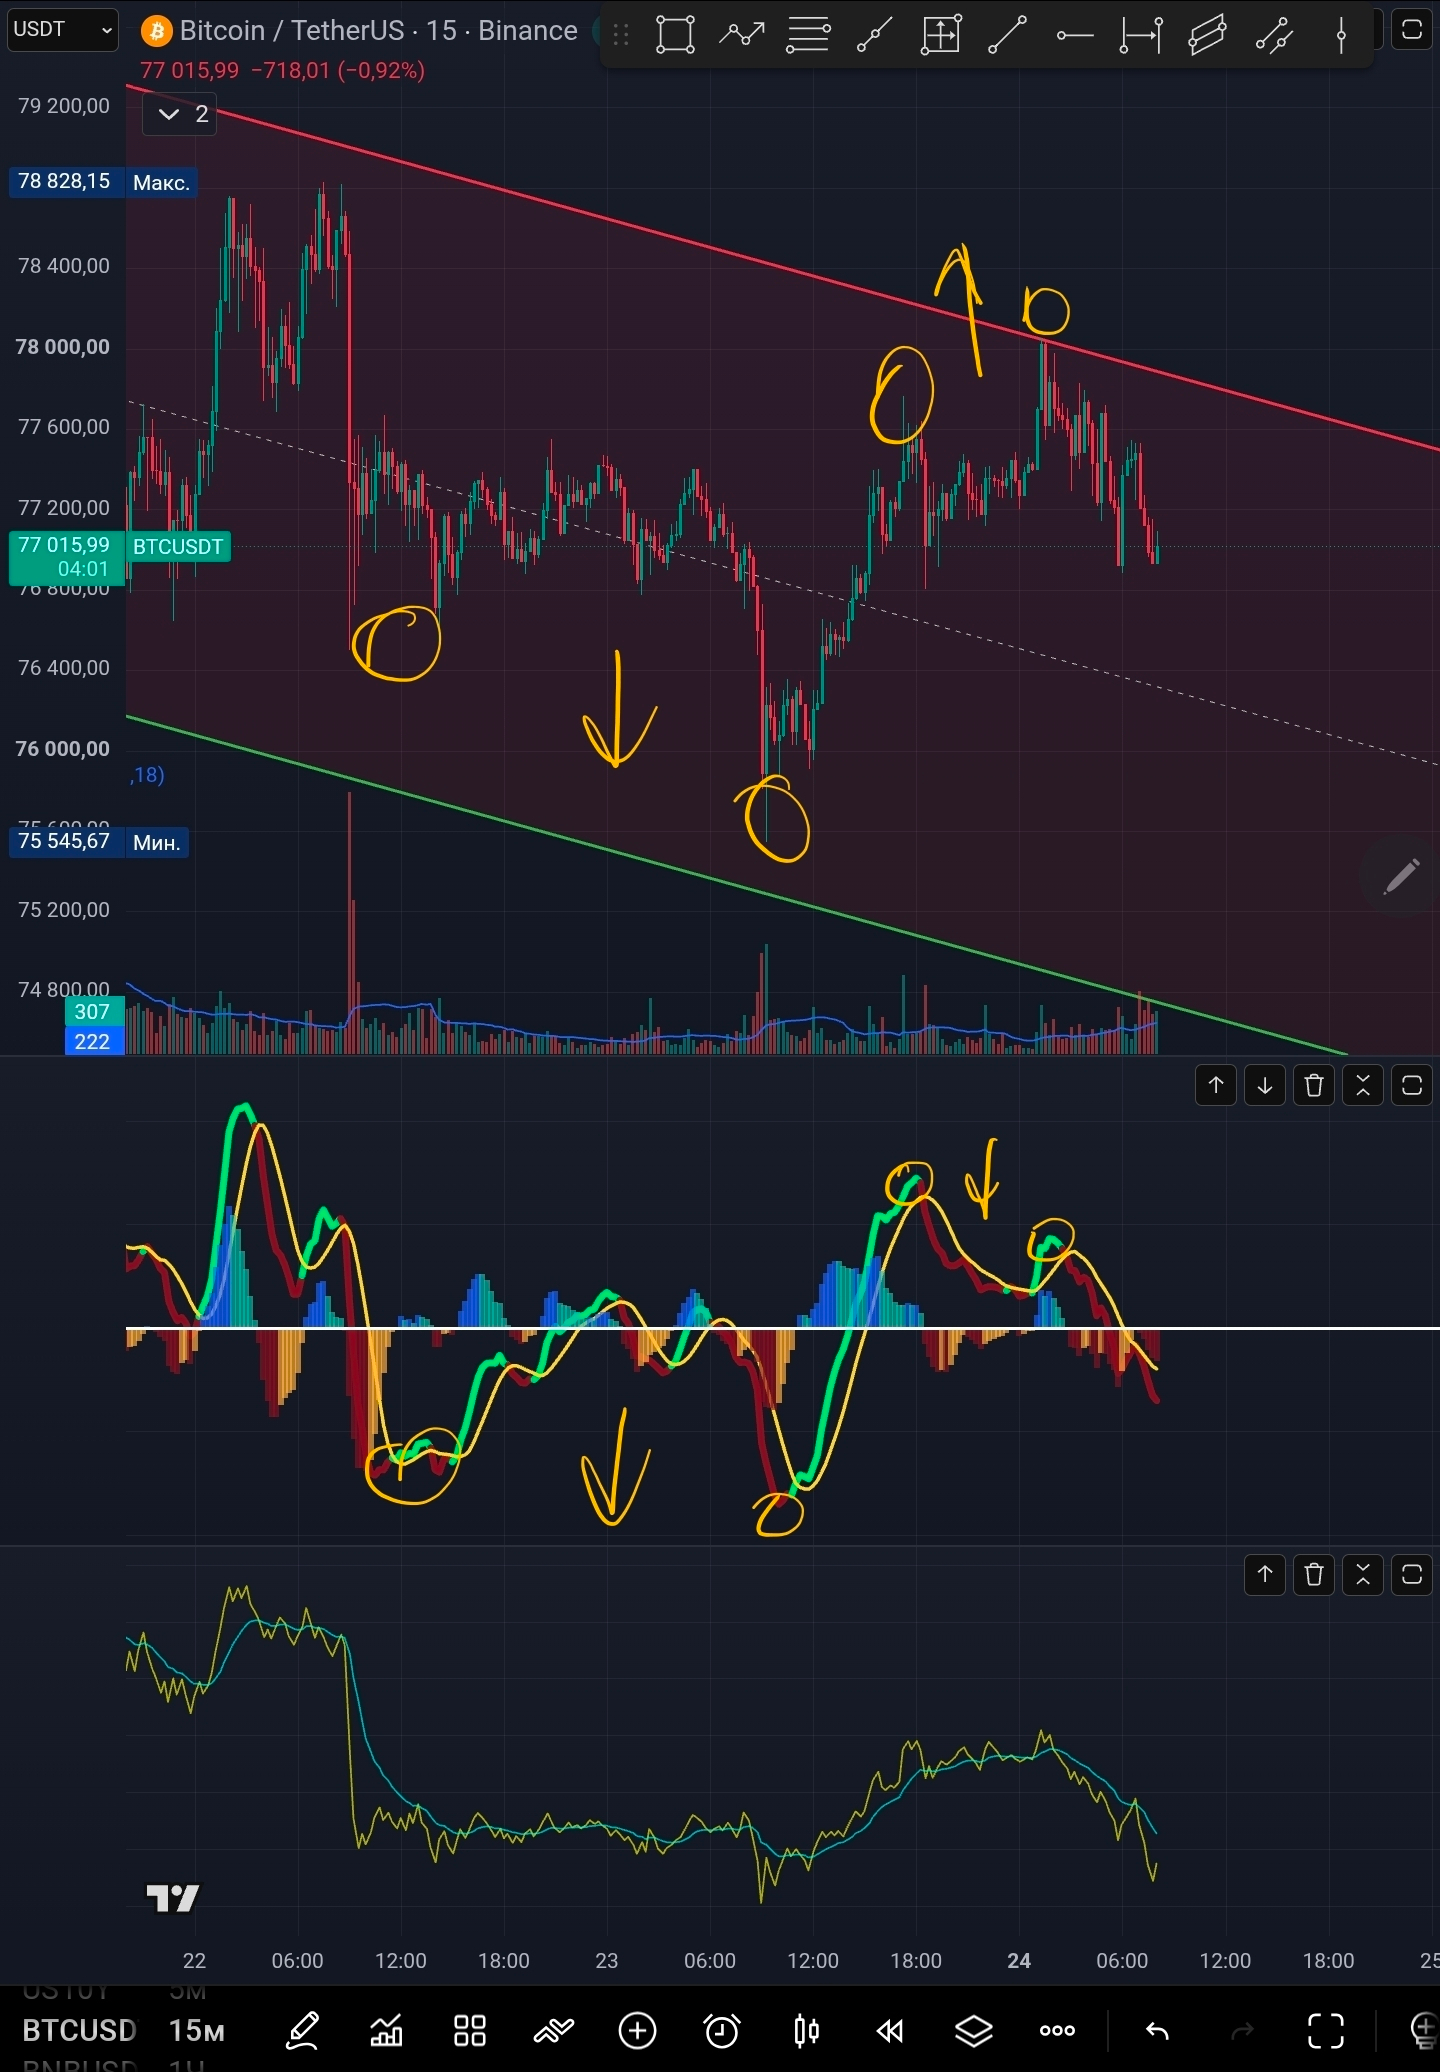
📍 On 15-minute candles. The price has strength at the lows, the indicator updates its minimum, and it shows weakness at the highs. The indicator indicates a bearish divergence. The overall bias is negative.
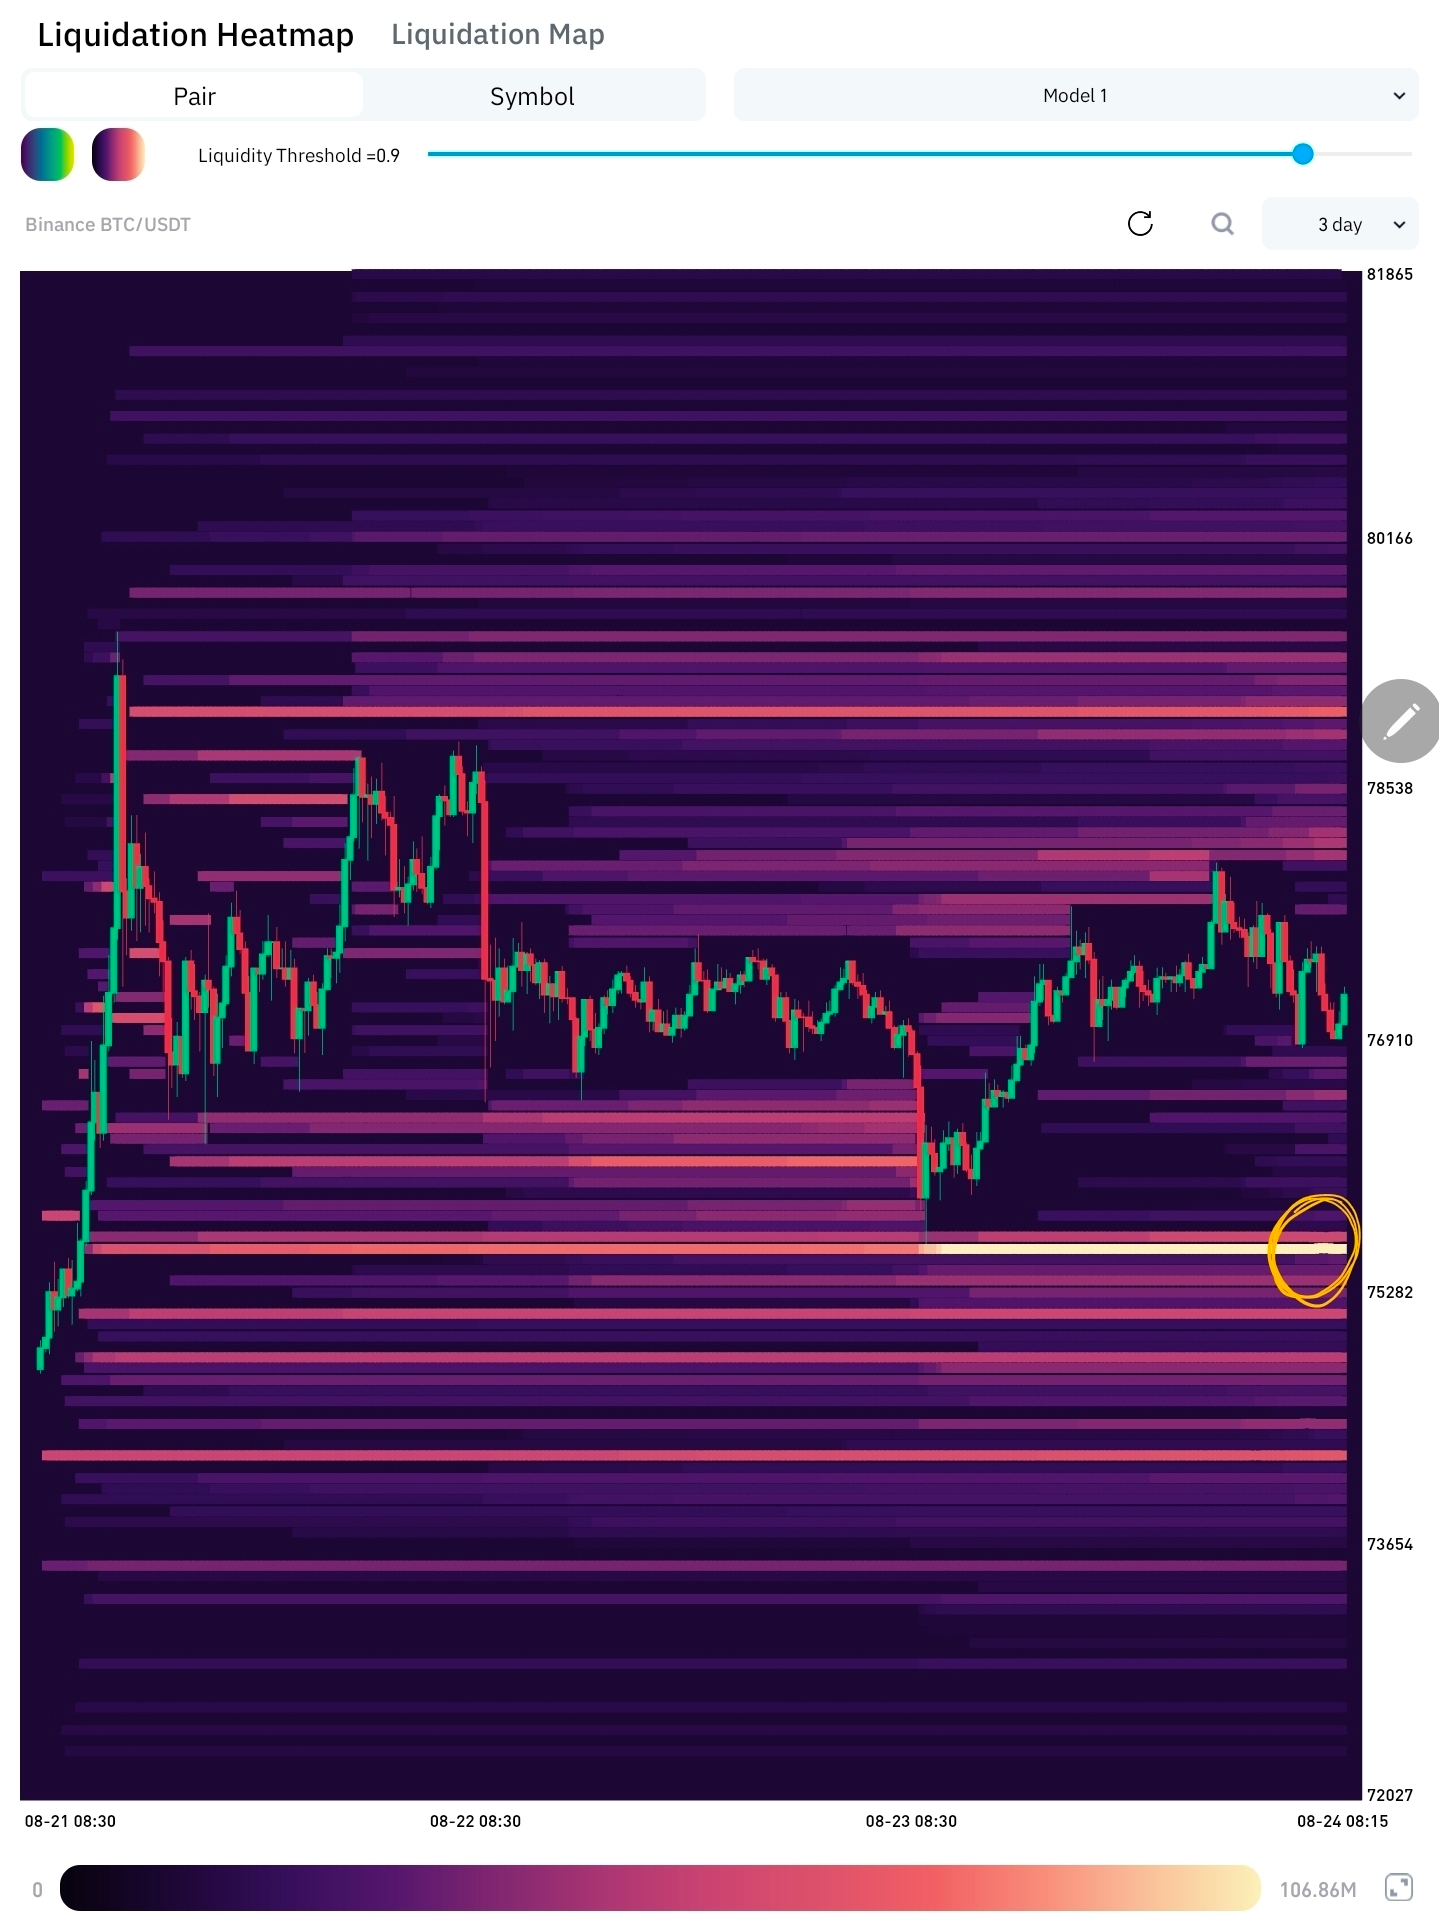
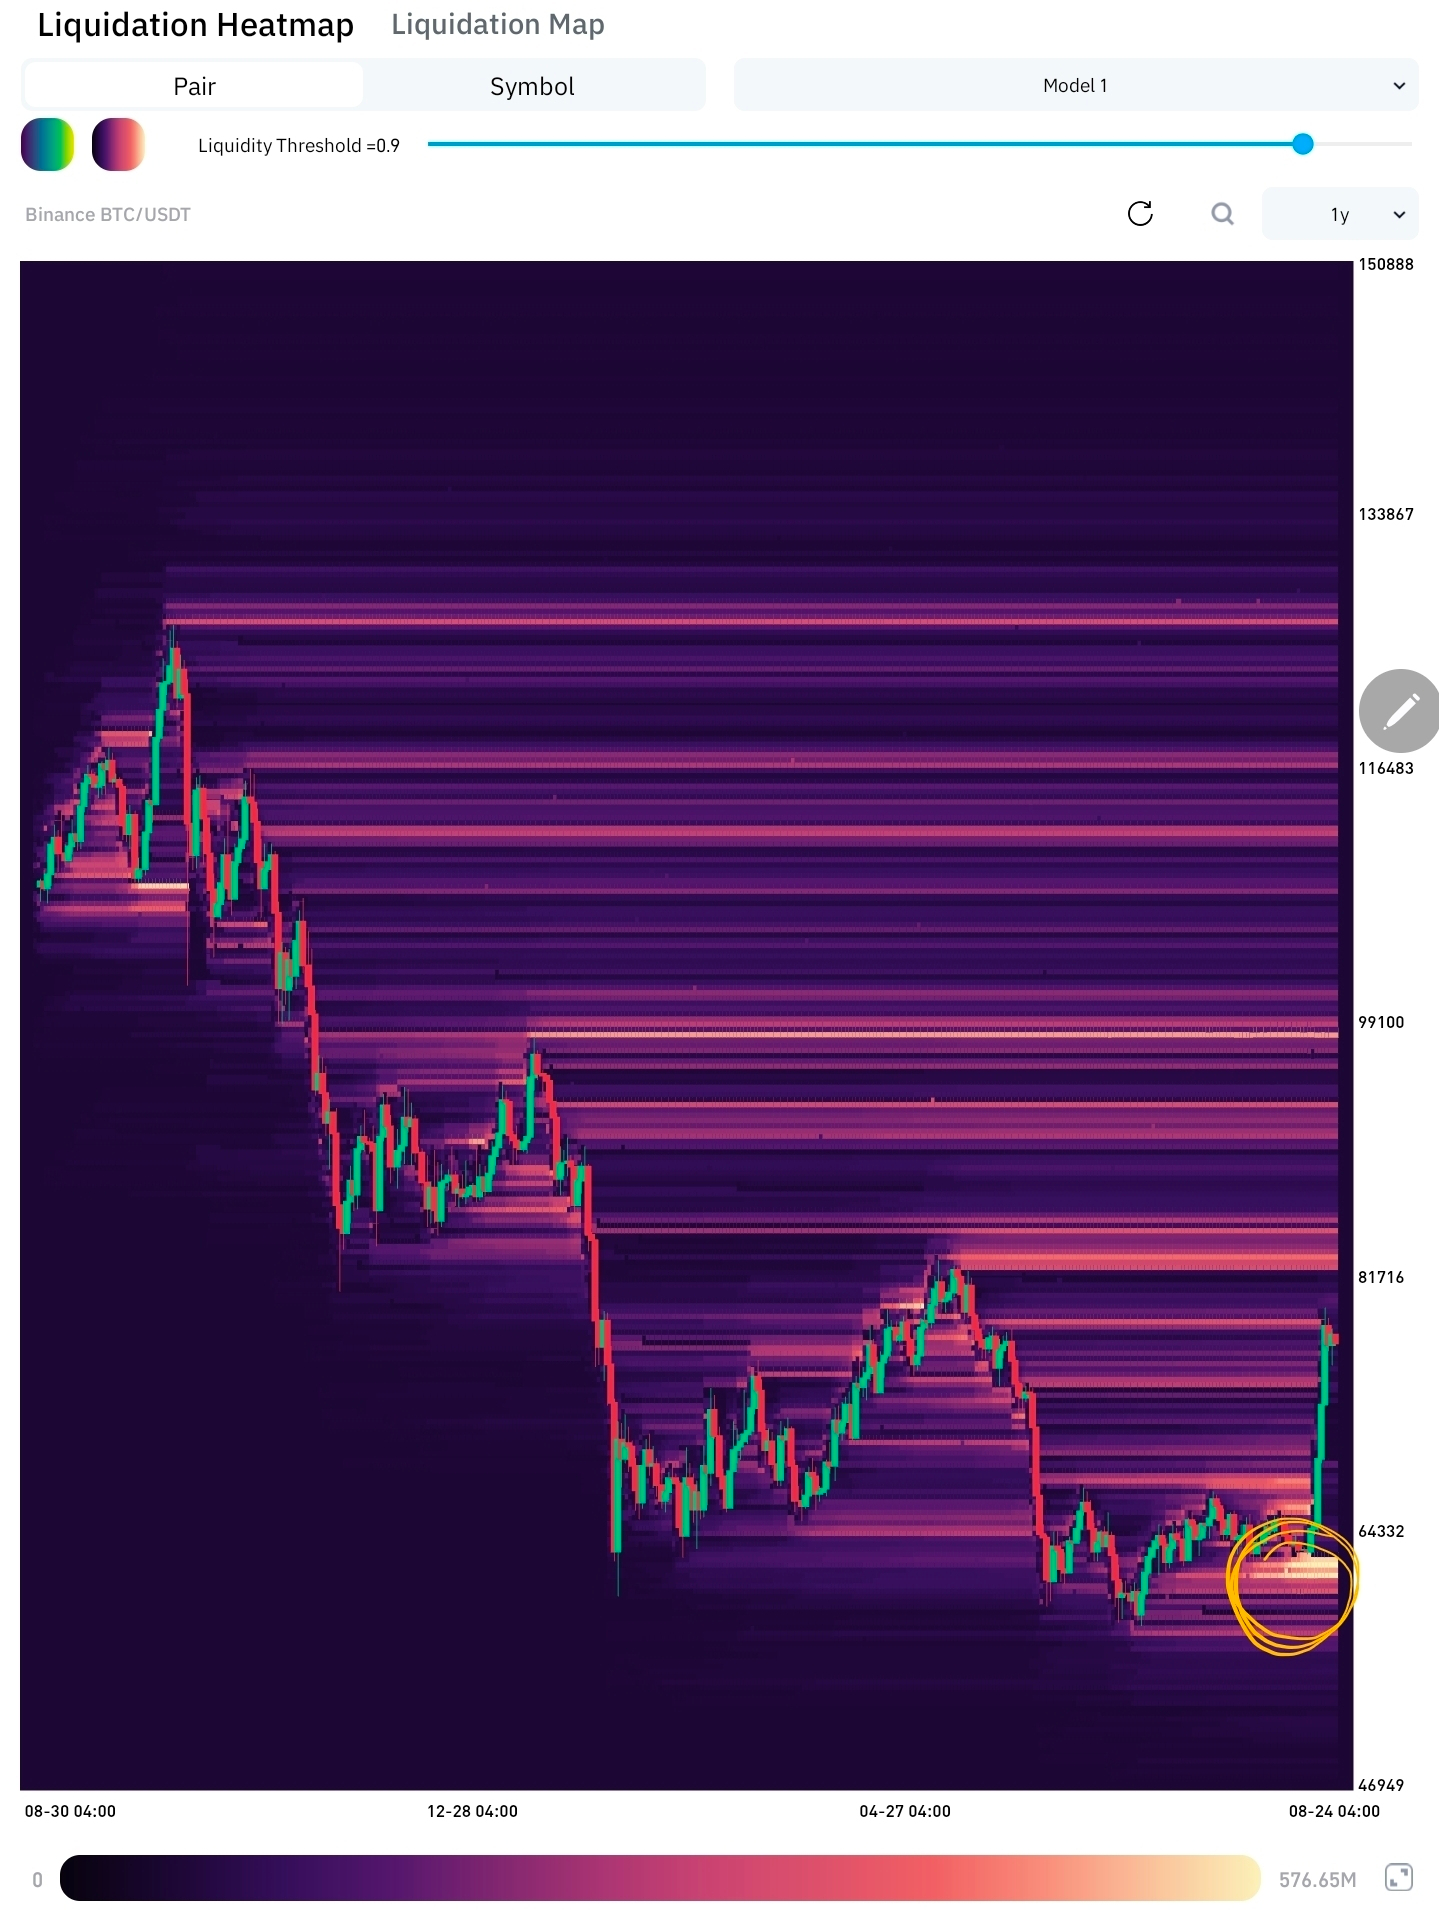
📍 The heat map gives us a hot level 75566k. Otherwise the levels remain the same as before; the highest level right now is the 61–62 area.
📍 Before I make a conclusion, I need to clarify that I don’t trade futures and don’t know how the market will behave for those who work with futures. Everything I write applies to spot only, and if you read it and repeat what I do, you should be ready for drawdowns.
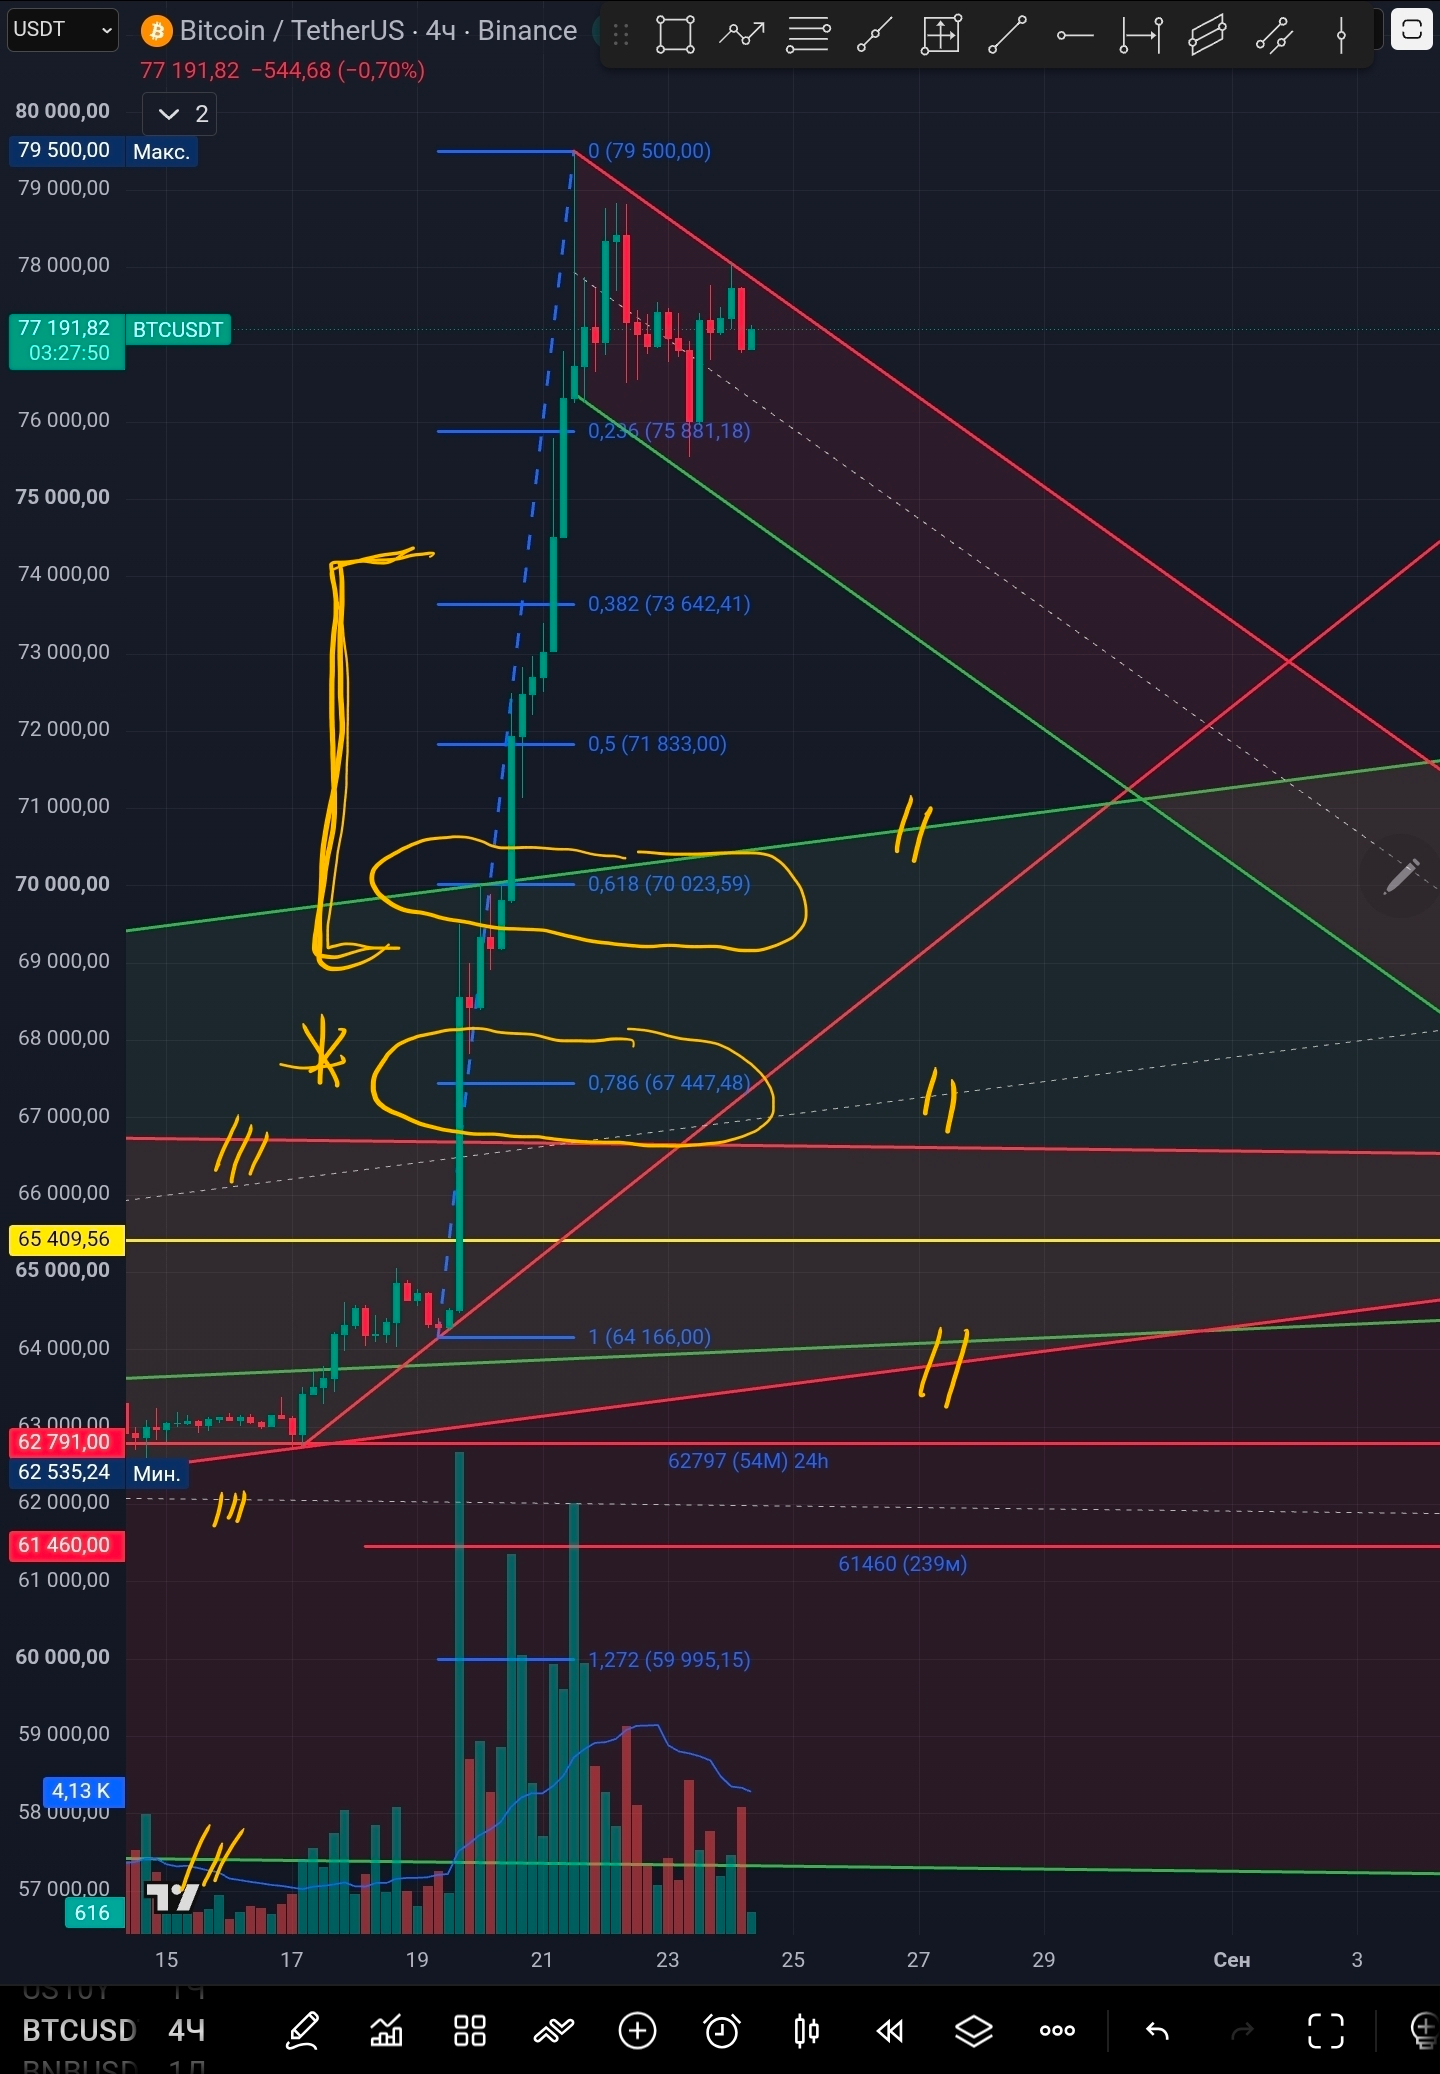
📍 So we see a strong upward impulse. Like any impulse, regardless of which direction it’s in, it should correct even without any hints from indicators. This isn’t because something changed in the market—it’s just that the first most cautious investors and traders start taking profit. They understood they already had enough from this 20% move and think it’s better to re-enter the market again than to lose what they accumulated on the way down. Reminding you that closing long positions is a sell order.
The move resulting from long positions has a tendency to correct toward the 0.3–0.6 Fibonacci level, where I will be tracking it.
📍 It looks like the move was pulled up on purpose so that the 0.6 lower correction would act as the support line of the former upward price channel, and the 0.7 correction line would act as the support line of the former downward flag.
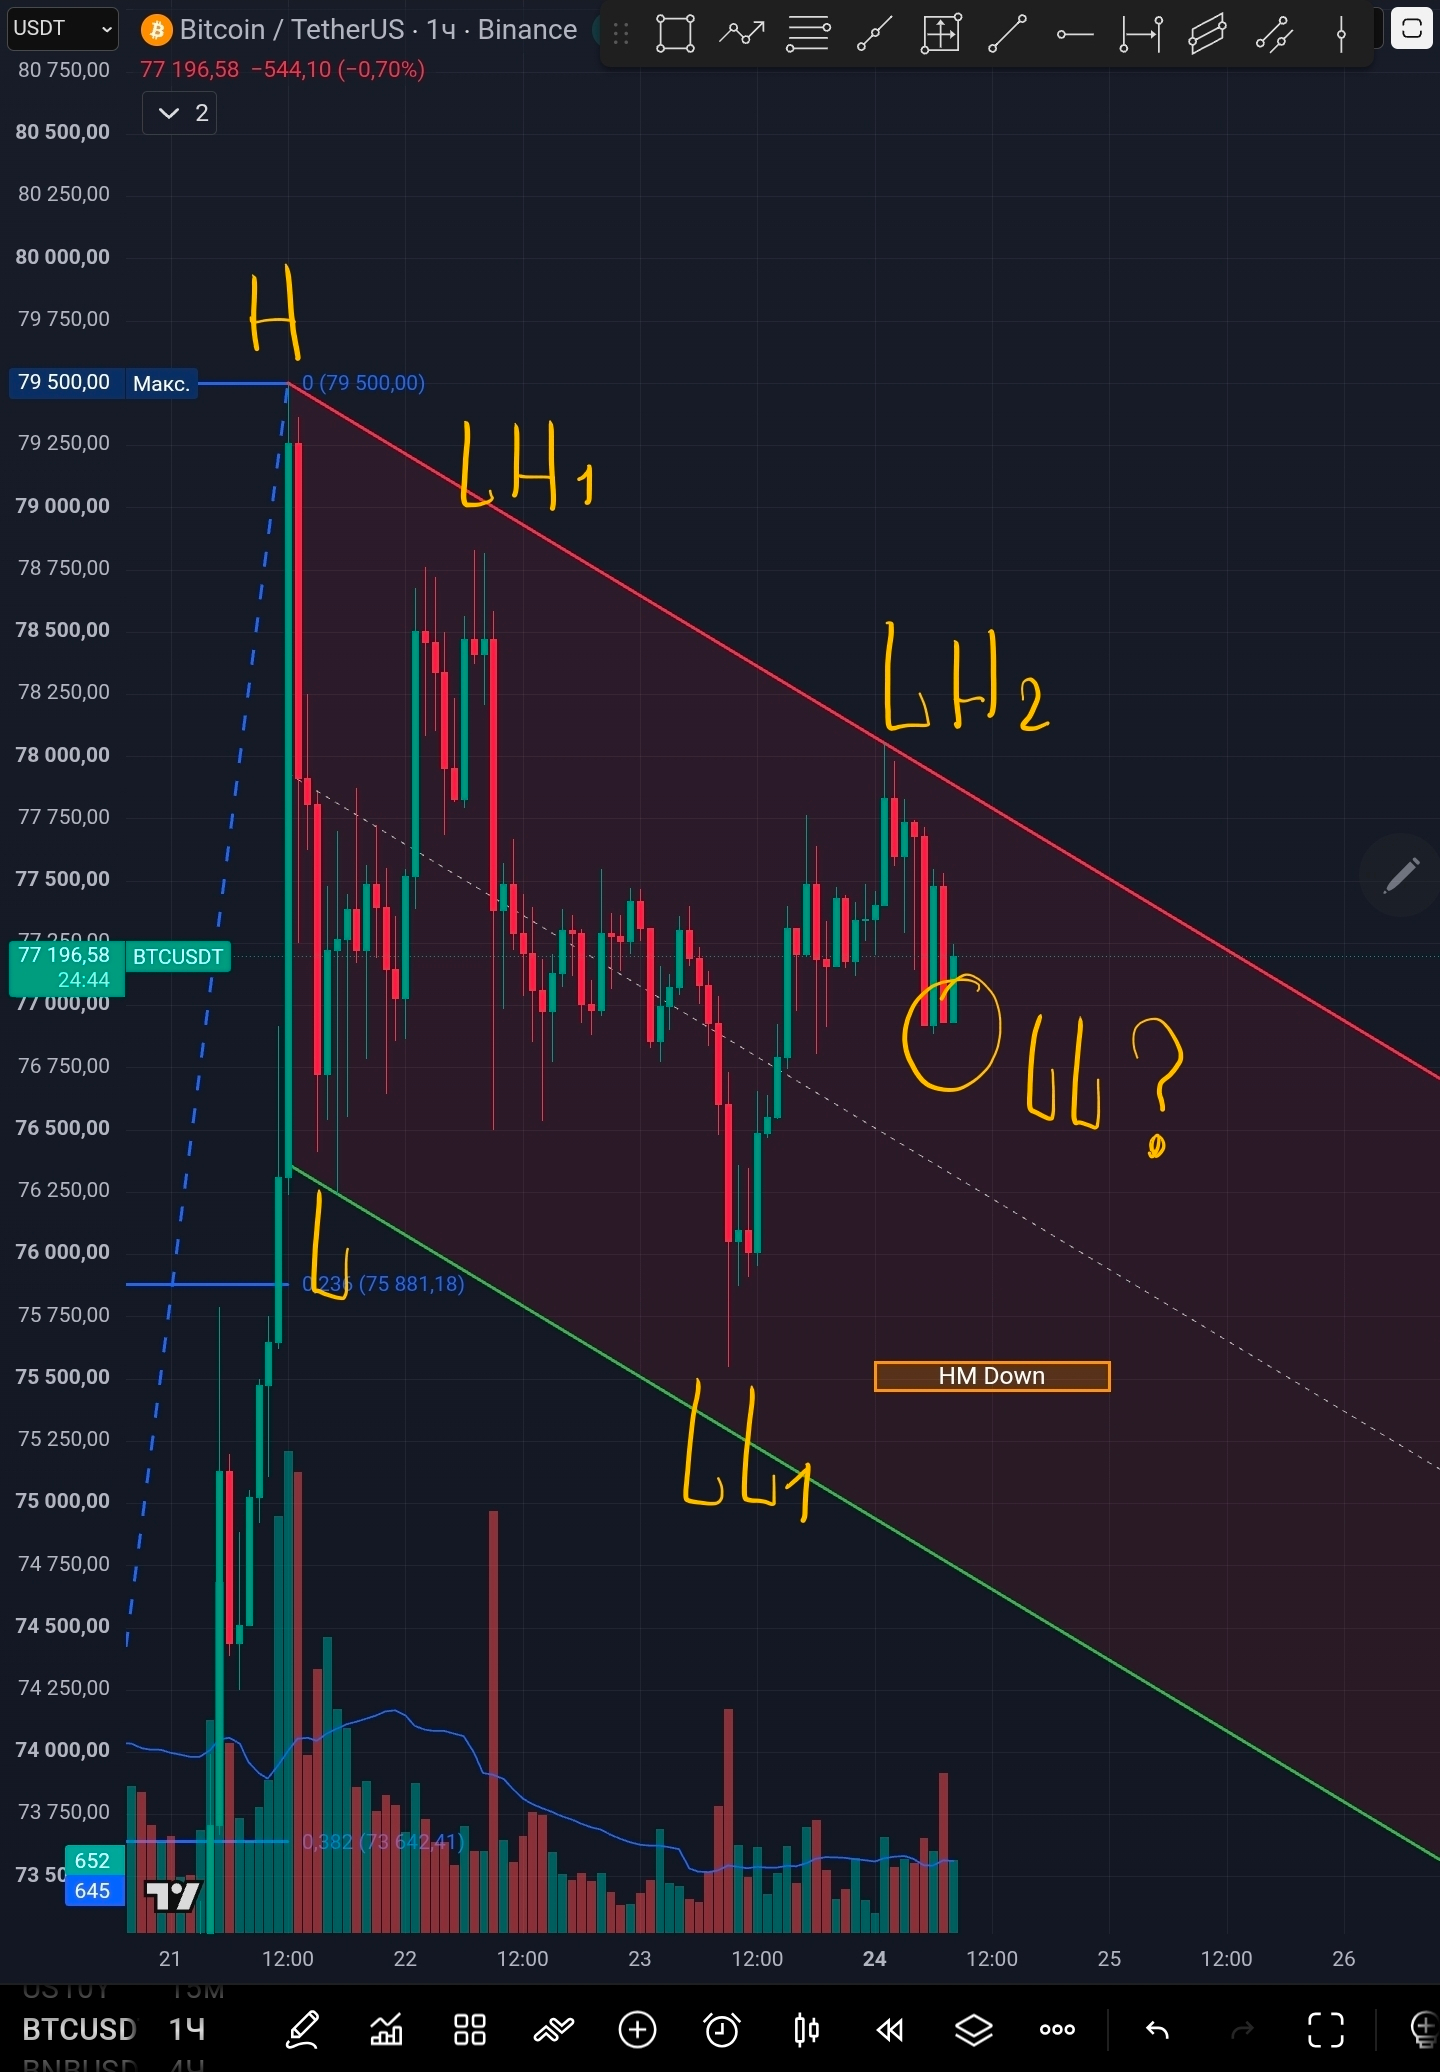
Right now, on the hourly charts, we have a bearish downward structure. As for how to look for a break of structure in previous moves: as long as a new low below the previous one hasn’t formed yet, we’ll see whether it will form. Any further upward movement needs to be monitored after a structure break.
📍 Separately, I want to say something about the liquidation map. At the moment, during strong impulses and trending moves, the liquidation map shows nothing interesting—it only indicates the price’s maximums and minimums that we can already see. It works well in a sideways range, but not in a trend impulsive move. You and I saw how price broke the 67,500 level like it was some scrap paper, without even stopping, liquidating the bears for one and a half billion. Price doesn’t always reach the hot zones of the liquidation map, especially if a trend reversal has happened. In all likelihood, in 2022 the largest liquidation map volumes were below $15,000, and people were waiting for the price to come into that zone.
Keep an eye on updates in the comments to this post. I’m waiting for your well-reasoned opinion on this situation. Use my information only as a reference for how to approach market analysis—not as your own trading strategy or financial advice. Make your trades only based on your own analysis, experience, and conclusions. Green P&L to you, my Crypto brothers 🙌.
✨✨✨
Thank you, Crypto brothers, who are showing activity and helping me promote my content. If you like my work, you can support the author and the daily releases via subscription, comments, reposts, likes, or the Tips feature. Thank you in advance 🙌