


Pi Network (PI) fell by a double-digit percentage, recording a 15% loss. Although prevailing market sentiment indicates that sellers (bears) are currently controlling the price trend, there isn’t enough data to suggest a major breakdown is likely—on the contrary, the healthiest scenario is the one that’s closest.
## Pi’s real test is still at the bottom
Market structure data shows that Pi has been trading within an ascending triangle pattern, and the recent pullback represents a drop toward the support line on the chart.
The support line is the diagonal trendline; this level has prevented the market from falling on three different occasions previously, pushing the asset higher again. This is the second attempt by the price to trade downward toward the support level, and yet no actual breakdown has occurred below this level. If a breakdown happens, the price may find support at the horizontal level of $0.085.
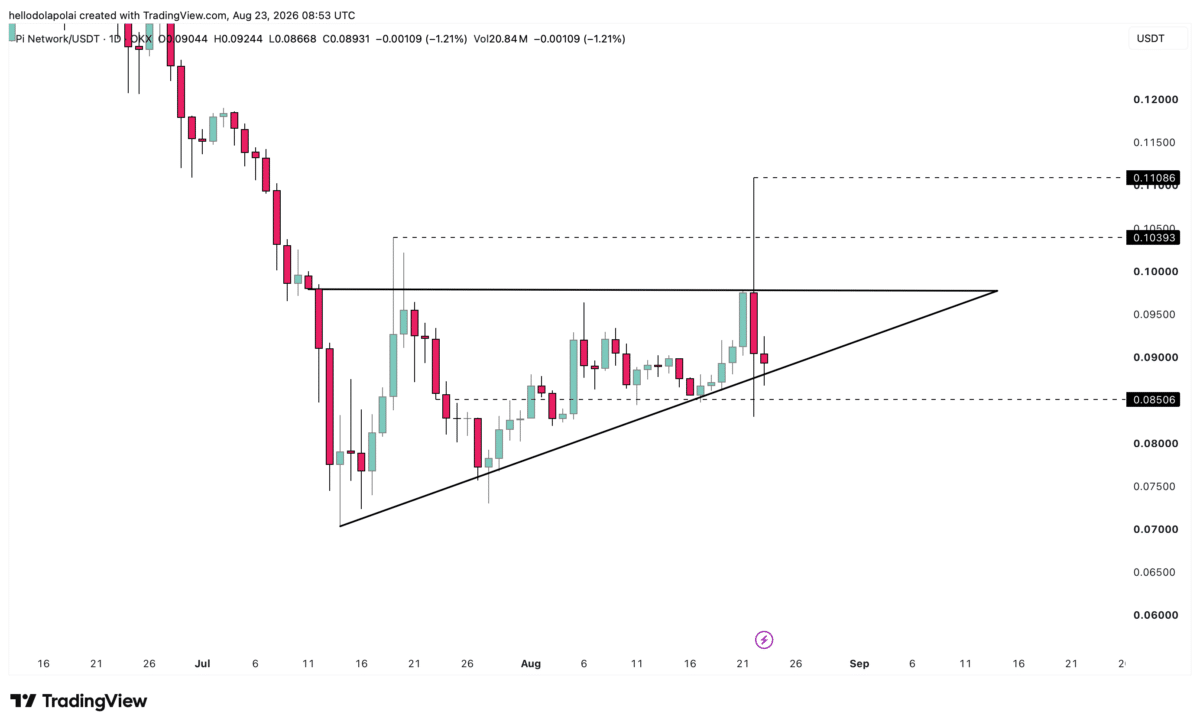
Ideally, the price may consolidate within this channel before a bullish breakout above resistance, which could lead to a new peak on the chart. If that happens, the likely near-term targets would be $0.103 and $0.110. However, there remains a possibility that consolidation continues along this line before any bullish breakout.
## Unfavorable capital flows
Investors do not appear particularly optimistic about the price right now, which may limit capital inflow into the market. Both the Accumulation/Distribution indicator and the Money Flow Index (MFI) have fallen on the chart.
The A/D indicator is trending downward and stays on the sidelines, while the MFI is in the bearish zone, below 50.
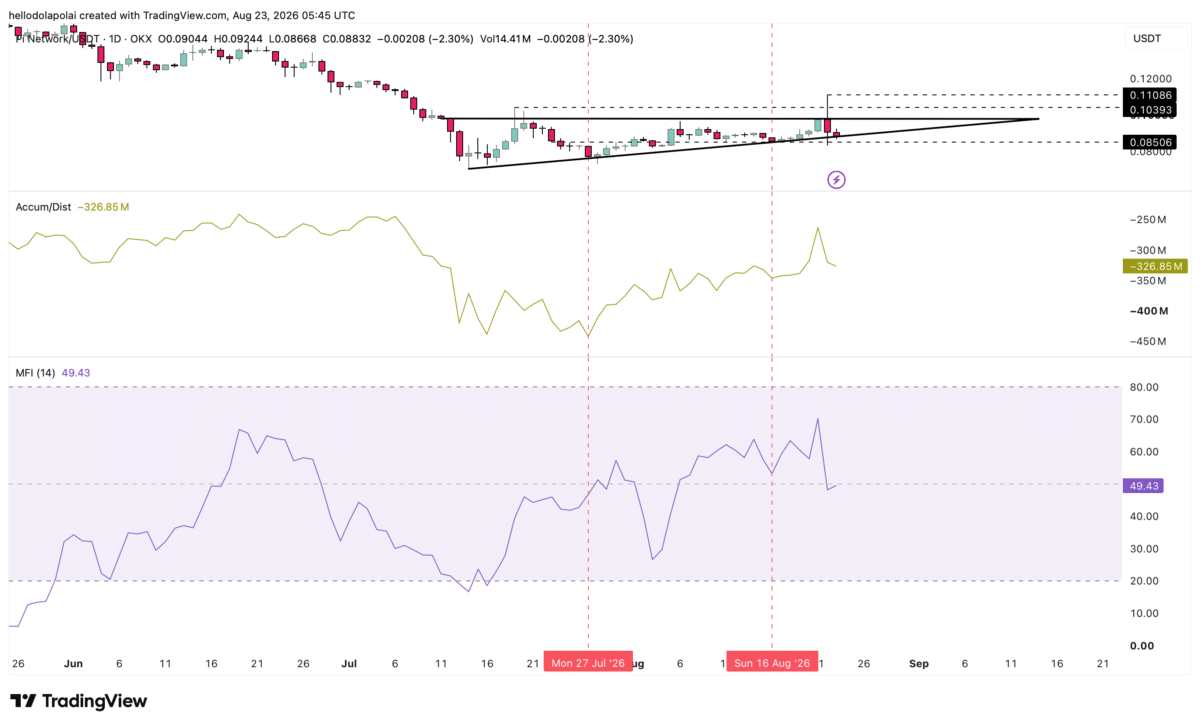
The A/D indicator is a volume-weighted indicator used to determine whether there is buying or selling pressure, while the MFI tracks the total buying and selling activity in the market.
In the previous two occasions when the price traded at the support level on the chart, both the A/D and MFI indicators were trending upward. But that is not the case right now.
And it is noted that the MFI needs to rise above the 50 level before the market is considered bullish. Any breakout above this zone would mean investors are likely to continue moving capital toward the market. Likewise, the A/D indicator will need further rise for bullish speculators to consolidate control.
## Funding and the market are still good
There was clear bullish sentiment across exchange activity, as both the Funding Rate and Open Interest remained in a bullish position.
The funding rate stands at 0.0050 on the chart, meaning there are more long positions in the market, and showing that traders are still buying the asset. At the same time, open contracts register a reading of $2.3 million in the market.
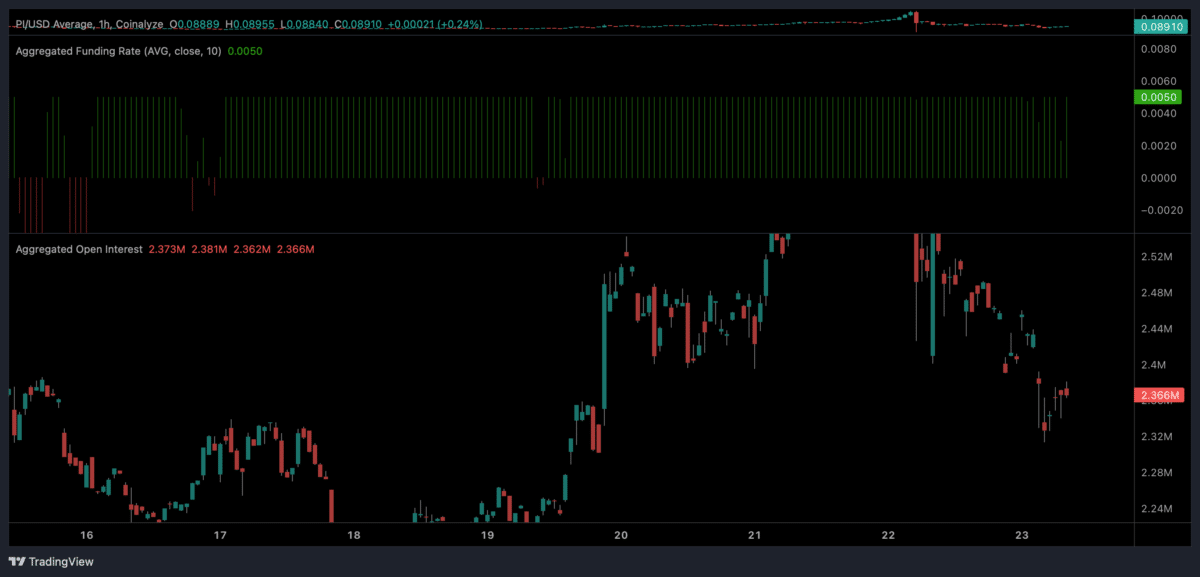
The funding rate will play a key role in helping the asset maintain its bullish outlook, especially in the near term.
## Summary
- Pi tests a major triangle support level after dropping 15%, with a possibility that any breakdown will reveal support at $0.085
- Bullish speculators need stronger capital flows and a move above $0.103 to increase the odds of a push toward $0.11
---
Note: This is technical analysis and not investment advice, and trading cryptocurrencies involves very high risk#PiNetwork