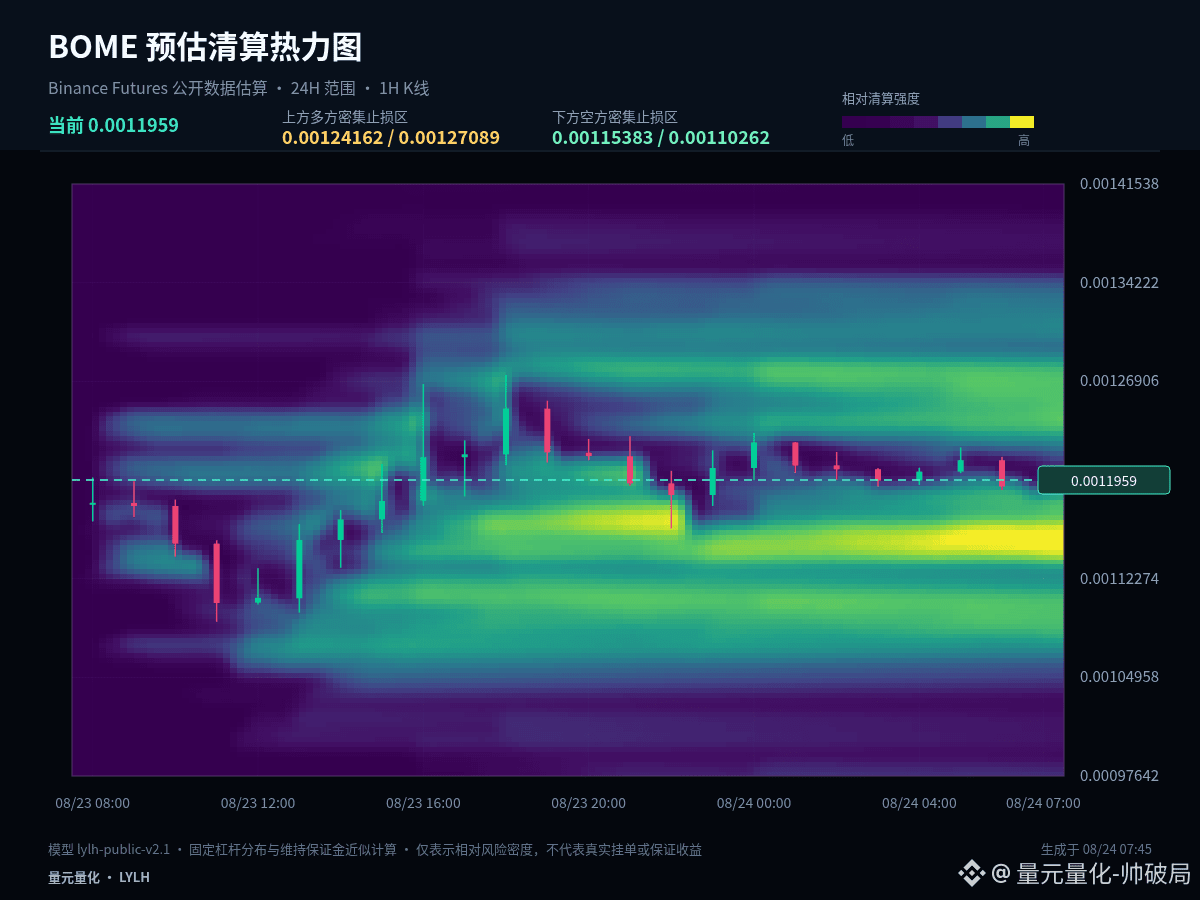
$BOME #BOME In a strong trend, pullbacks often reveal the real buying support better than accelerated rallies. The current 1-hour change is +0.35% and the 24-hour change is +1.94%, so it is necessary to judge whether this is a normal cooldown or a weakening structure.
The current 1-hour +0.35% and 24-hour +1.94% readings do not show enough clear same-direction alignment across the two periods. In a range-bound market, chasing strength or selling weakness has a lower margin for error. It is more suitable to use the upper boundary to confirm direction, the lower boundary to confirm support, and the midline only as the dividing line between strength and weakness.
Short-term initiative has not been clearly broken. 0.0011846 is the primary standard for judging the quality of the pullback. Holding above it and then retesting 0.0012769 would indicate relatively strong consolidation; if the midline is broken and price continues to stay below it, then the focus of observation should shift down to 0.0010923.
My projection is not a single-sided bet. If price breaks above 0.0012769 and can hold there, it means the upside room has reopened; if it breaks below 0.0010923 and fails to rebound back above, it means the structure is weakening further; if it trades between the two, continue watching the closing behavior on both sides of 0.0011846.
For those already holding positions, the key is to manage based on whether support has failed, rather than being driven by every fluctuation; for those with no position, it is better to wait for a breakout pullback or support confirmation. Spot positions can be entered in batches, while derivatives should shorten the decision chain: first determine the stop-loss level, then decide whether to participate.
Risk control still comes before conclusions: execute only when conditions appear, and reassess promptly if price invalidates the setup; the greater the volatility, the more restrained each individual position should be. The above is a market projection based on the current 1-hour and 24-hour data and does not constitute a promise of returns.
#BitcoinStrongestWeekSinceMarch2023
The current 1-hour +0.35% and 24-hour +1.94% readings do not show enough clear same-direction alignment across the two periods. In a range-bound market, chasing strength or selling weakness has a lower margin for error. It is more suitable to use the upper boundary to confirm direction, the lower boundary to confirm support, and the midline only as the dividing line between strength and weakness.
Short-term initiative has not been clearly broken. 0.0011846 is the primary standard for judging the quality of the pullback. Holding above it and then retesting 0.0012769 would indicate relatively strong consolidation; if the midline is broken and price continues to stay below it, then the focus of observation should shift down to 0.0010923.
My projection is not a single-sided bet. If price breaks above 0.0012769 and can hold there, it means the upside room has reopened; if it breaks below 0.0010923 and fails to rebound back above, it means the structure is weakening further; if it trades between the two, continue watching the closing behavior on both sides of 0.0011846.
For those already holding positions, the key is to manage based on whether support has failed, rather than being driven by every fluctuation; for those with no position, it is better to wait for a breakout pullback or support confirmation. Spot positions can be entered in batches, while derivatives should shorten the decision chain: first determine the stop-loss level, then decide whether to participate.
Risk control still comes before conclusions: execute only when conditions appear, and reassess promptly if price invalidates the setup; the greater the volatility, the more restrained each individual position should be. The above is a market projection based on the current 1-hour and 24-hour data and does not constitute a promise of returns.
#BitcoinStrongestWeekSinceMarch2023