$ZAMA Jumps 8.57%, but Volume Hides a Surprise ⚠️
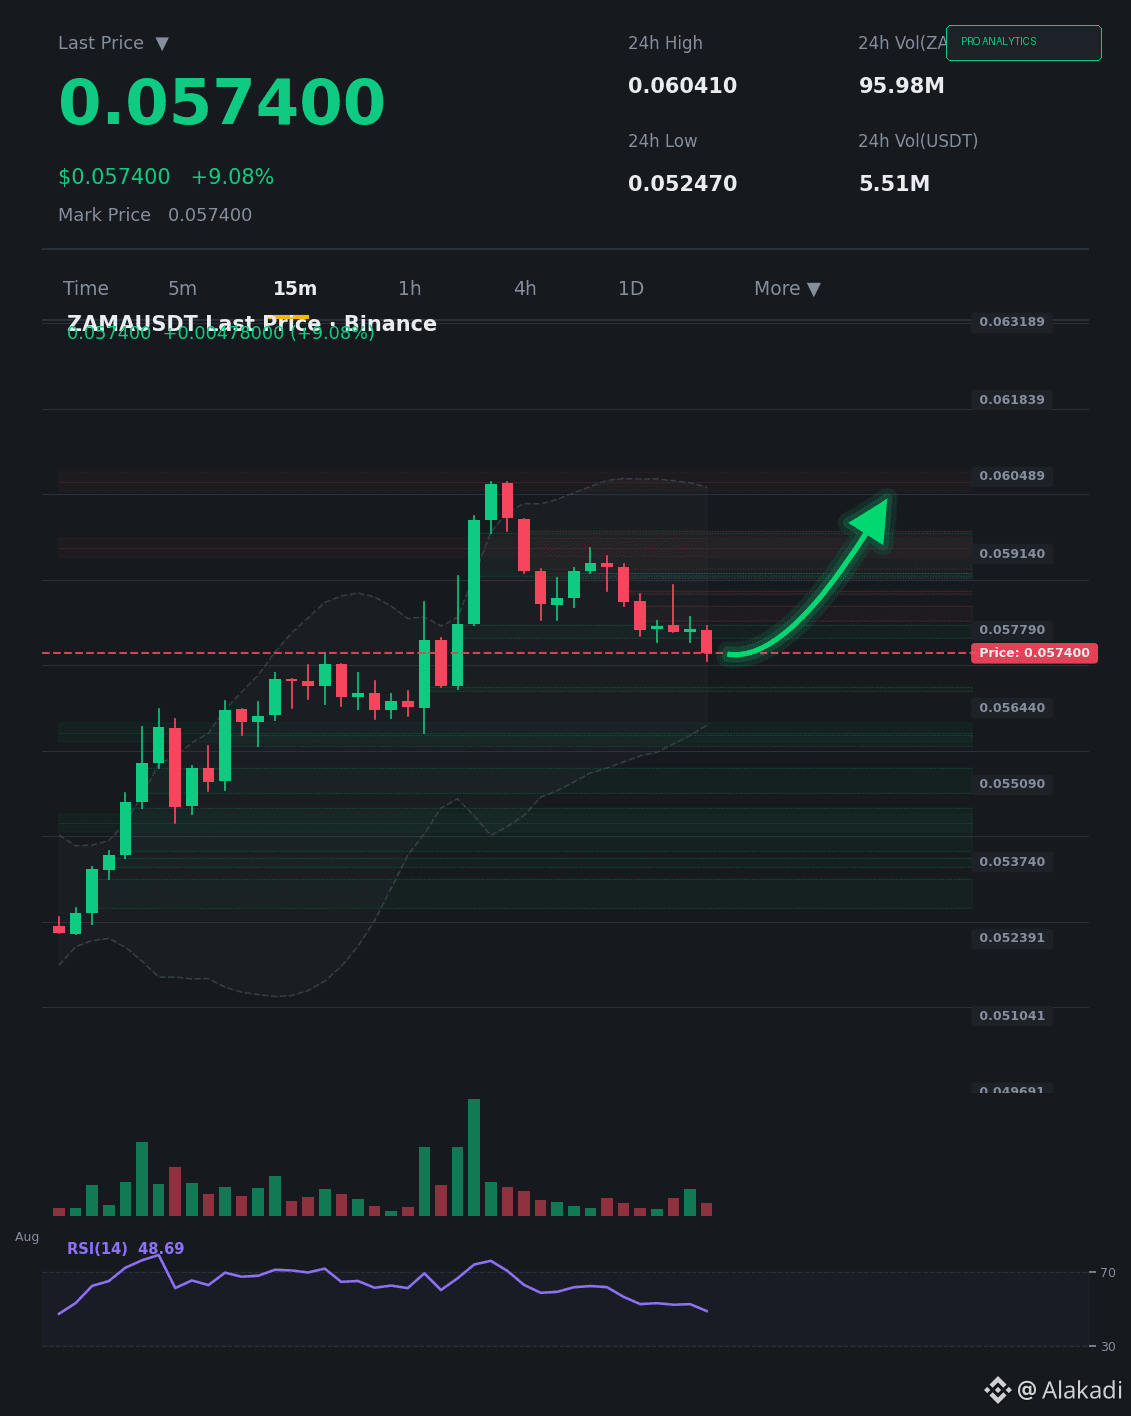
$ZAMA /USDT is trading at 0.0574 with a 8.57% rise over the past 24 hours; however, the volume ratio of 0.61 reveals a 39% decline in liquidity compared to the normal rate. On the 15-minute chart, the rising candles show small bodies with upper wicks, indicating weak follow-through from buyers. RSI is nearing the 65 zone without a clear breakout above the 70 level.
Positive scenario: A breakout in volume versus the average, with a 15-minute close above 0.058, paves the way toward 0.062 and then 0.065, targeting previous resistance.
Negative scenario: If volume stays below average, the price may retest 0.054 and then 0.051, with a double-top pattern forming on the lower timeframe.
The decisive factor: Confirm the breakout with volume exceeding 1.2x the daily average.
Do you think the current momentum can attract new liquidity, or is it a weak corrective move?
$ZAMA
This content is not investment advice. Do your own research (DYOR)
$ZAMA /USDT is trading at 0.0574 with a 8.57% rise over the past 24 hours; however, the volume ratio of 0.61 reveals a 39% decline in liquidity compared to the normal rate. On the 15-minute chart, the rising candles show small bodies with upper wicks, indicating weak follow-through from buyers. RSI is nearing the 65 zone without a clear breakout above the 70 level.
Positive scenario: A breakout in volume versus the average, with a 15-minute close above 0.058, paves the way toward 0.062 and then 0.065, targeting previous resistance.
Negative scenario: If volume stays below average, the price may retest 0.054 and then 0.051, with a double-top pattern forming on the lower timeframe.
The decisive factor: Confirm the breakout with volume exceeding 1.2x the daily average.
Do you think the current momentum can attract new liquidity, or is it a weak corrective move?
$ZAMA
This content is not investment advice. Do your own research (DYOR)