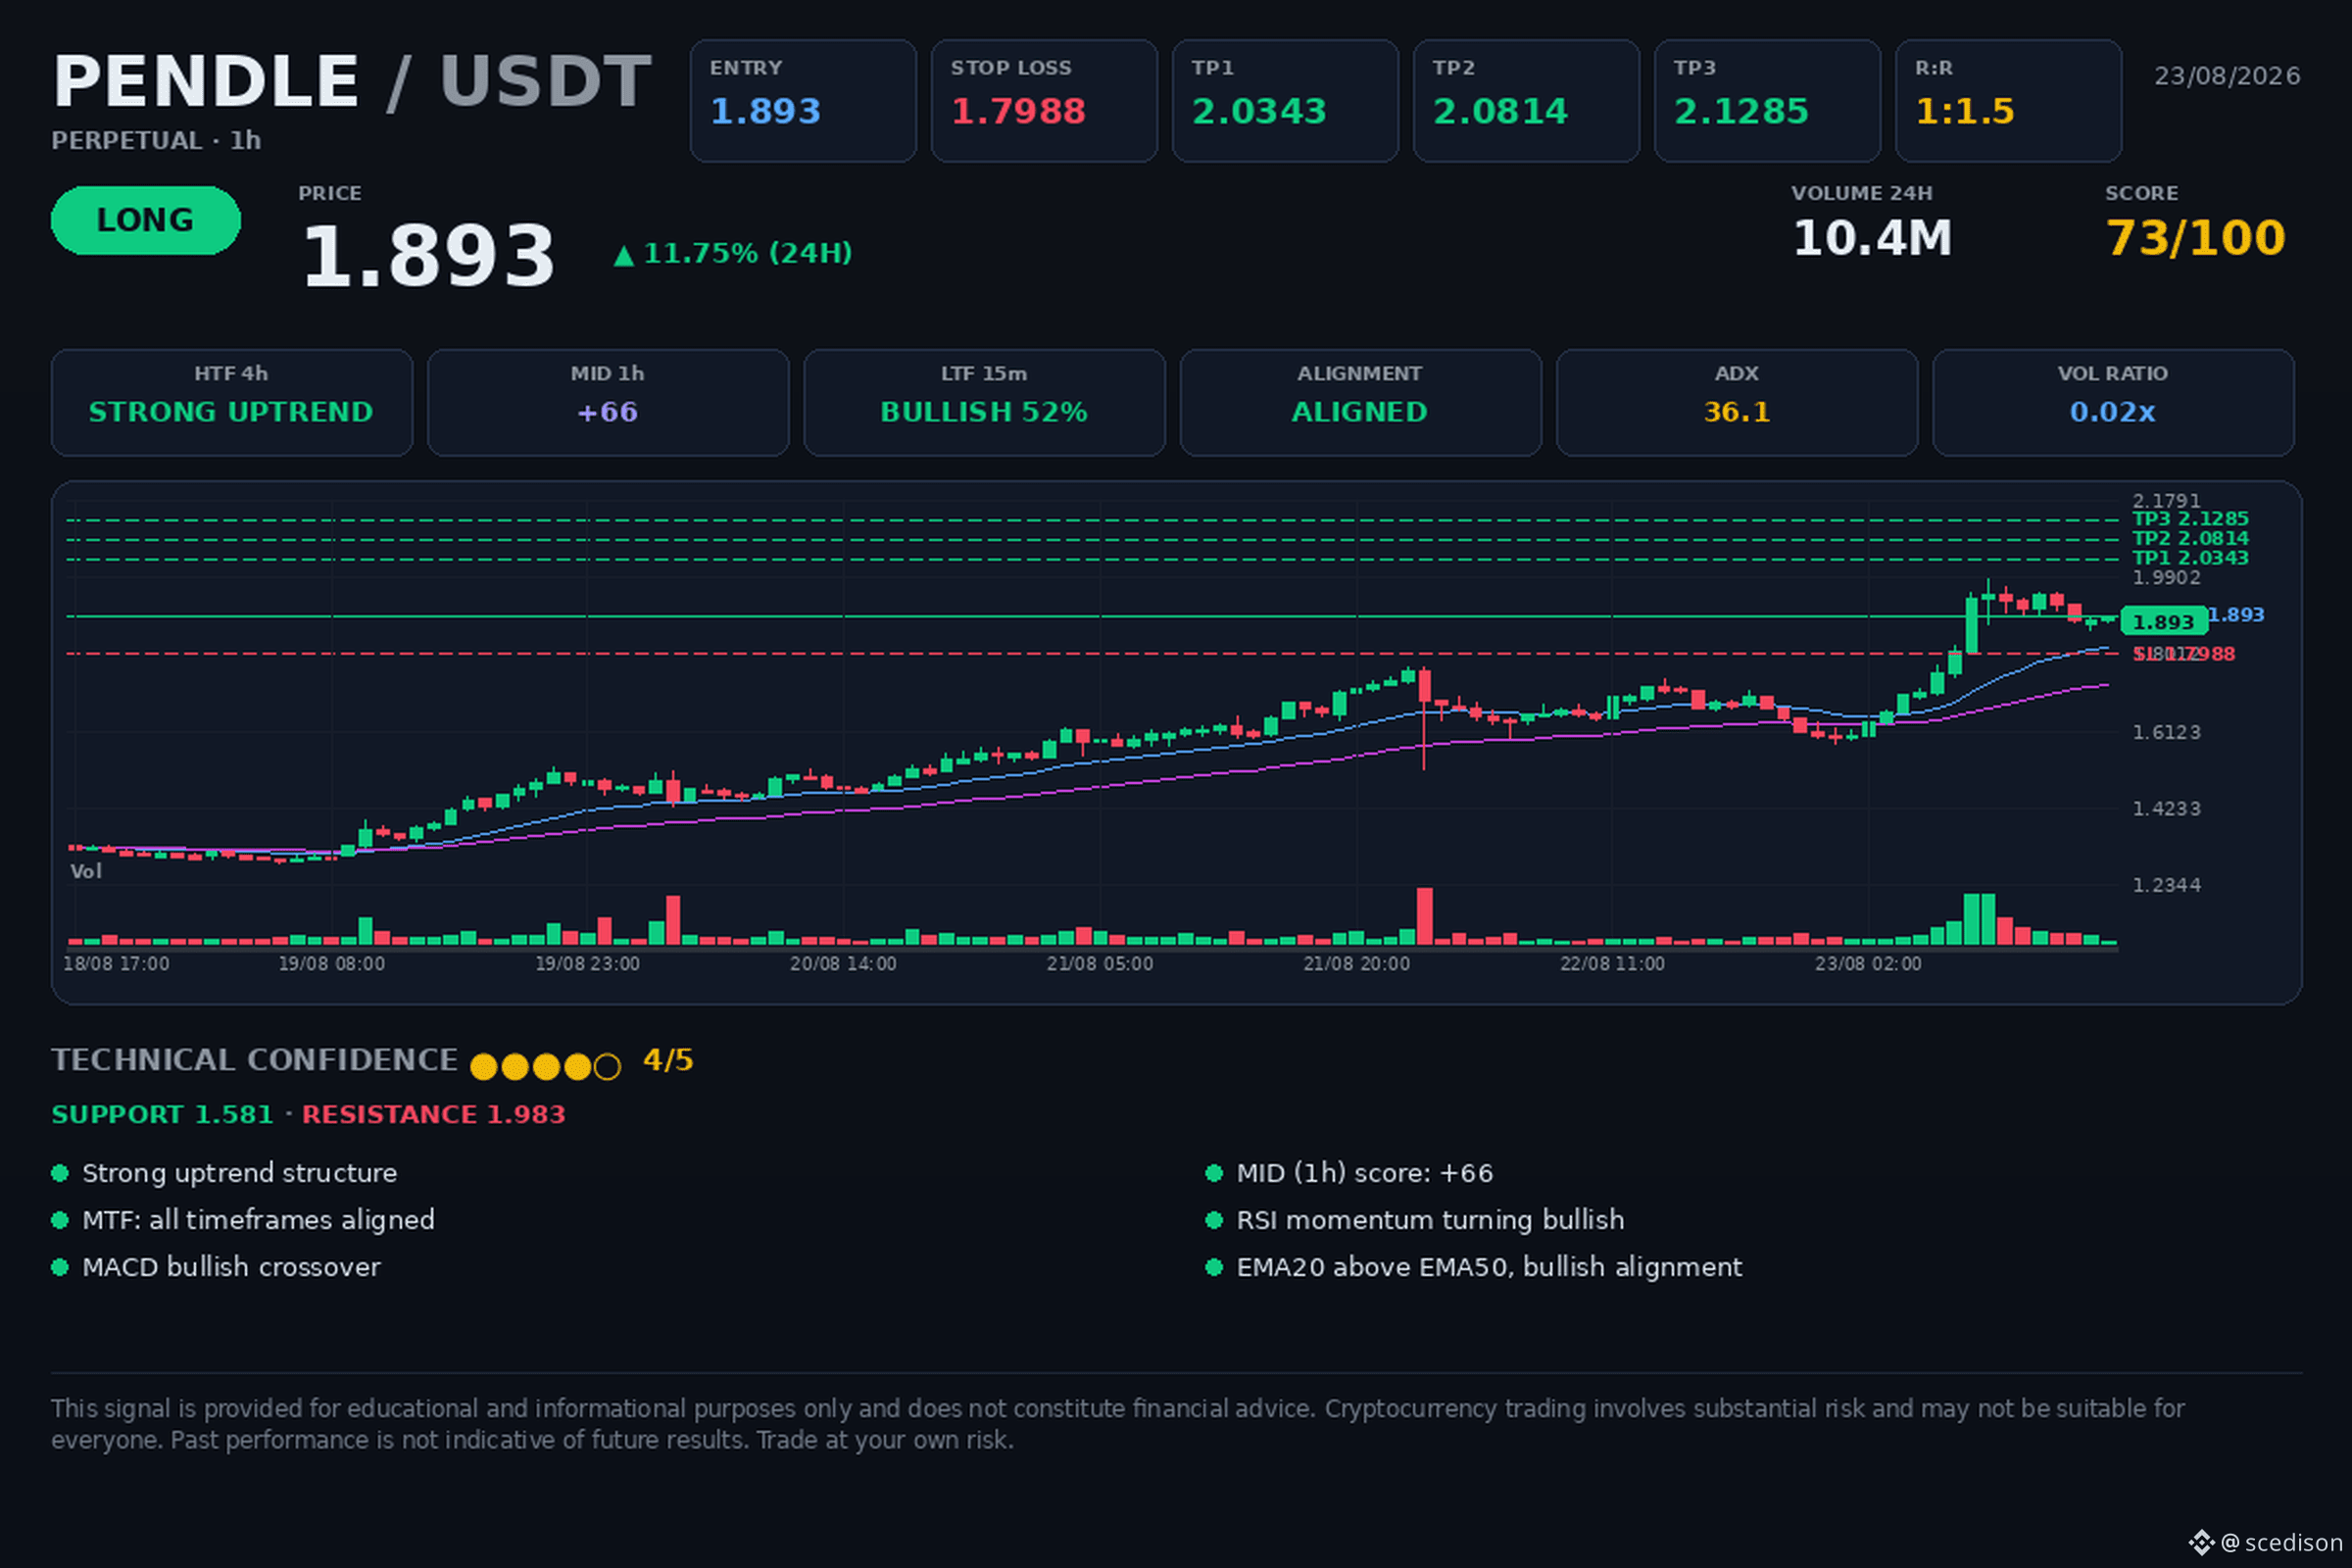
📢 $PENDLE / $USDT | 🟢 LONG | ⭐ 73.1%
🎯 Target: $2.0343. Does it achieve it?
🎯 Trading levels:
🟢 Entry: $1.893
🛑 Stop Loss: $1.7988
🏁 TP1: $2.0343
🏁 TP2: $2.0814
🏁 TP3: $2.1285
📈 Analysis:
The asset $PENDLE shows a bullish multi-timeframe alignment, with a technical structure supported by a confirmed triple-bottom pattern that drives the price above the EMA20 and EMA50 moving averages (moving averages that smooth price to identify the trend). The ADX at 36.14 confirms strong trend strength, while the MACD indicates a bullish crossover (a positive momentum signal) and the RSI at 65.86 leaves room before entering overbought territory.
⚖️ Risk/Reward: 1:1.5
⏱️ Timeframe: 1H
📐 Technical confidence: 4/5
The bullish thesis is invalidated if the price breaks the stop loss at $1.7988, a level that would negate the structure of higher highs and higher lows. It’s important to monitor volume behavior at the immediate resistance of $1.983, since a close above the VAH (volume area high—the maximum volume value in the market profile) would confirm the continuation of the impulse.
Do you think the current volume is enough to break the $1.983 resistance in the short term?
💡 This analysis is for educational purposes and is not financial advice. Do your own research and decide calmly.
#crypto #PENDLE #trading #Futures #Bullish
🎯 Target: $2.0343. Does it achieve it?
🎯 Trading levels:
🟢 Entry: $1.893
🛑 Stop Loss: $1.7988
🏁 TP1: $2.0343
🏁 TP2: $2.0814
🏁 TP3: $2.1285
📈 Analysis:
The asset $PENDLE shows a bullish multi-timeframe alignment, with a technical structure supported by a confirmed triple-bottom pattern that drives the price above the EMA20 and EMA50 moving averages (moving averages that smooth price to identify the trend). The ADX at 36.14 confirms strong trend strength, while the MACD indicates a bullish crossover (a positive momentum signal) and the RSI at 65.86 leaves room before entering overbought territory.
⚖️ Risk/Reward: 1:1.5
⏱️ Timeframe: 1H
📐 Technical confidence: 4/5
The bullish thesis is invalidated if the price breaks the stop loss at $1.7988, a level that would negate the structure of higher highs and higher lows. It’s important to monitor volume behavior at the immediate resistance of $1.983, since a close above the VAH (volume area high—the maximum volume value in the market profile) would confirm the continuation of the impulse.
Do you think the current volume is enough to break the $1.983 resistance in the short term?
💡 This analysis is for educational purposes and is not financial advice. Do your own research and decide calmly.
#crypto #PENDLE #trading #Futures #Bullish