


Sober Options Studio × Derive.XYZ Joint Production

Written by Sober Options Studio Analyst Jenna @Jenna_w5
1. Macroeconomic Overview: The Reversal of 'Monetary Trust Trade' Under the Expectation of a Fed Leadership Change
1.1 Asset Repricing Within a Day: Precious Metals Encounter Historical 'Deleveraging Moment'
Last Friday, global macro assets underwent a highly asymmetric and severe repricing. Spot silver (XAGUSD) once plunged over 35% during trading, setting a record for the largest single-day decline since records began; gold (XAUUSD) fell by 11%, marking the worst day since January 1980. In stark contrast, the US Dollar Index (DXY) rose by 0.9% in a single day, and the yield on the US 10-year Treasury quickly rose to 4.24%, while the S&P 500 Index only slightly retreated by 0.4%.
This is not a typical 'collective sell-off of risk assets,' but rather resembles a structural correction around 'currency trust.' From a cross-sectional view, funds have not fully withdrawn from risk assets: the decline in US stocks is moderate, and the credit market shows no systemic pressure; the assets that have been concentratedly sold are precious metals, previously seen as hedges against 'currency distrust.' In other words, this impact is not a collapse in risk appetite, but a negative correction of the existing macro trading narrative.
1.2 The Warsh effect: seemingly contradictory, but actually changes the pricing logic of the US dollar
The direct catalyst for igniting all of this is the market's repricing of the potential new chair of the Federal Reserve—Kevin Warsh's policy stance.
Warsh's core issue is: his policy combination points in two directions. On one hand, he has publicly expressed support for a 'faster path of interest rate cuts'; on the other hand, he has clearly emphasized the need to accelerate the reduction of the Federal Reserve's balance sheet (Quantitative Tightening, QT) to rebuild monetary discipline. This set of positions is not contradictory in macroeconomics, but at the trading level, it has completely shattered the previously crowded logical assumptions of the market.
Over the past year, the historical highs of gold and silver are essentially a joint pricing of three things:
Doubts about the long-term purchasing power of the US dollar
Concerns about the weakening of the Federal Reserve's political independence
Bets on the 'nominal interest rate cuts + implicit easing' policy path
Warsh's emergence has led the market to seriously consider for the first time: If interest rate cuts come at the cost of 'faster balance sheet reduction,' will the US dollar truly depreciate systematically? Last Friday's strong rebound of the US dollar, alongside the synchronized collapse of precious metals, is the direct answer to this question—the market begins to retract the previously cast vote for 'currency distrust.'
1.3 From the perspective of options and market makers: This is a stampede amplified by 'Gamma'
It is incomplete to explain the sharp decline in gold and silver prices solely through macro logic. What truly transformed the decline into a 'historical level' drop was the mechanical amplification mechanism of the derivatives market. Prior to this, the precious metals options market experienced a record surge in net buying of call options.
Goldman Sachs points out in its latest research that this unidirectional structure, through market makers' Delta Hedging behavior, has formed a positive feedback loop of 'buy-up - hedge - buy-up again': 1) Investors buy calls; 2) Options sellers are forced to buy futures or spot to hedge Delta; 3) Price increases further stimulate more call buying.
However, when the direction reverses, this mechanism operates in a completely opposite manner. In the early stage of the decline in gold and silver prices, the hedging demand of options sellers quickly shifted from 'buying the underlying' to 'selling the underlying,' and in high Gamma ranges, this hedging behavior exhibits significant nonlinear characteristics. The result is: price declines → increased hedging selling → accelerated Gamma release → amplified declines.
This is precisely the typical reverse version of a Gamma Squeeze.
1.4 Resonance of the leverage system: the vicious cycle of margin adjustments and passive liquidations
Beyond the derivatives structure, risk control adjustments at the exchange level have further intensified volatility. Recently, major precious metals exchanges, including CME, the Shanghai Futures Exchange, and the Shanghai Gold Exchange, have successively raised margin ratios for gold and silver futures. This measure has limited impact during price increases, but during declines, it poses fatal pressure on highly leveraged accounts. When prices decline rapidly, a typical chain reaction occurs:
Price declines trigger stop-losses
Insufficient margin triggers forced liquidation
Passive selling further depresses prices
Program trading and CTA strategies follow synchronously
This led to a situation that should have been a 'trend correction' rapidly evolving into a liquidity-driven capitulation-style sell-off.
1.5 Outlook: Warsh has yet to take office, but 'expectation management' has already begun to take effect
It is important to emphasize that Powell will not officially step down until May at the earliest, and whether Warsh will ultimately head the Federal Reserve remains uncertain. However, in the current data vacuum and highly uncertain policy environment, expectations themselves are the strongest market variable.
Compared to other potential candidates, Warsh's policy stance is not radical:
He did not deny the necessity of interest rate cuts
But he emphasizes the need to advance alongside balance sheet reduction
Attempting to strike a balance between liquidity management and inflation control
This means that even if interest rate cut signals are released in the future, their pace and intensity may significantly be lower than the market's previous easing expectations. The asset performance last Friday has already informed us in advance: the market is re-pricing this 'more complex policy function.'
II. In-depth analysis of the BTC & ETH options market data
Combining chart data provided by Amberdata & Derive.XYZ, in the context of expectations for a Federal Reserve leadership change, cryptocurrency assets have not detached from the global asset pricing system, with their risk premiums primarily released through the options market rather than spot prices. Observing from three dimensions of Skew, term structure, and volatility risk premium (VRP), the options surfaces of BTC and ETH this week exhibit highly consistent characteristics: short-term panic is systematically repriced, and seller advantages are rapidly converging.
Skew: The gloom of short-term sentiment has eased somewhat
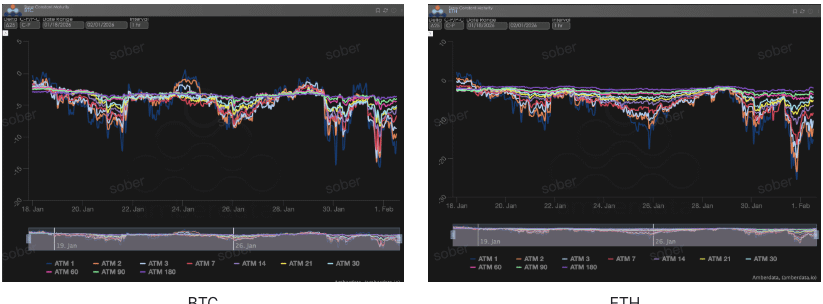
Observing Delta 25 Skew (implied volatility IV of call options - IV of put options), the negative value reflects the market's hedging demand for downside tail risk.
Skew observation: The near-term Skew of BTC and ETH has shown marginal repair. This week, the ATM Skew of 1-7 DTE has significantly risen compared to last week, with the negative value range converging, showing a slight easing in short-term hedging demand for extreme downside tail risks.
In-depth interpretation: This change does not imply a turn to optimism in the market; rather, it likely reflects two real constraints: first, under the previous rapid decline and high IV environment, some short-end puts have been fully allocated; second, some trading capital has begun to hedge the rebound risks brought by 'repeated policy expectations' through calls or call spreads.
BTCÐ
Term Structure: Continuously inverted patterns
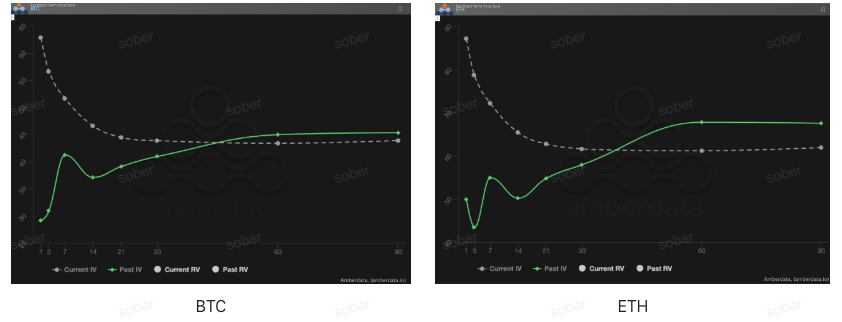
Term Structure displays the distribution of Implied Volatility (IV) across different expiration times.
Form anomalies: The current Current IV curves for BTC and ETH show a significant inverted formation, where near-term implied volatility is significantly higher than mid to long-term, failing to revert to the typical Contango (near low, far high) structure. Compared to last week, this week near-term IV has risen again, while mid to long-term IV has only slightly increased, resulting in no alleviation of overall inversion, and even deepening in certain timeframes.
In-depth interpretation: The pricing method of the inverted term structure highly fits the current environment: expectations of Federal Reserve personnel, tariff rulings, and the impact of administrative authorities on central bank independence all belong to events with 'defined time points but highly uncertain outcomes.' The options market thus chooses to concentrate on paying premiums within a short time frame rather than pricing for long-term structural volatility.
Volatility Risk Premium (VRP): Compression of seller profit margins
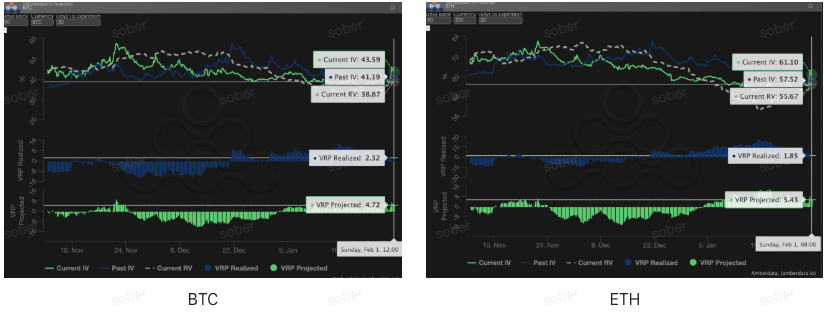
VRP (Volatility Risk Premium = Implied Volatility IV - Realized Volatility RV) is an important indicator for assessing whether options pricing is reasonable. The current market is in a correction phase.
Dynamic trends: This week, the IV and RV of BTC and ETH have risen in sync, but the speed of RV's increase is faster, leading to both VRP Realized and VRP Projected being compressed to single digits. Compared to last week, the 'high IV - low RV' buffer that sellers relied on has significantly narrowed, and options pricing is returning to a state closer to fair volatility.
In-depth interpretation: This phenomenon is not uncommon in macro event-driven markets. The expectation of a change in Federal Reserve leadership is not a one-time shock, but a risk source that may continue to ferment over the coming weeks, keeping realized volatility (Realized Volatility) persistently high. Meanwhile, although implied volatility remains high, it has become difficult to further increase significantly, thereby compressing VRP space. This environment is extremely unfavorable for pure options sellers: nominal premiums appear ample, but once prices exhibit continuous volatility, Gamma and Vega risks will swiftly erode profits.
Options data: traders' 'third eye' and multi-dimensional pricing power
In the complex macro environment of 2026, simple price movements (Spot Price) are often lagging, while options data serve as traders' 'third eye,' penetrating the surface to reveal the true defensive boundaries of capital.
For different trading styles, the observed data dimensions should vary significantly:
Short-term/intraday traders (Gamma Scalpers): Should focus on monitoring the Gamma Exposure (GEX) distribution of 1-3 DTE. For example, during the volatility period of the Federal Reserve leadership change on January 30, the concentrated strike prices of GEX formed strong physical support and resistance, helping short-term funds to exit precisely before liquidity exhaustion.
Trend/swing traders: Should focus on 25 Delta Skew and VRP Projected. When Skew remains in extremely low negative values while VRP stays high, it often signals excessive market panic, a typical 'reverse bottom-fishing' signal.
Institutional/long-term hedgers: Need to penetrate the Term Structure to observe changes in long-term Vega. By comparing Current IV with deviations from the 90-day average, one can assess whether current 'insurance' is overpriced, thus deciding whether to directly buy puts or construct more complex combination strategies.
Options data provide a dual dimension of 'probability' and 'cost.' To help investors better capture these asymmetrical opportunities, Sober Options Studio now offers a [customized options data tracking research report] service, providing in-depth profiling tailored to your specific positions and risk preferences. Feel free to inquire privately.
III. Options strategy recommendation: Bear put spread strategy to lock in downside risk
In response to the pricing environment of extreme panic in the near term and relative calm in the long term for January 2026, we do not recommend investors directly buy put options (Long Put), as the significant gap in current near-term IV means that 'insurance premiums' are at a phase high. At this time, the bear put spread strategy is the most cost-effective hedging tool.
3.1 Strategy construction (taking BTC as an example)
Buying put options (Long Put): Buy 1 near-month OTM Put with a Delta of about -0.4 (for example, a strike slightly below the current price by 5%-8%).
Selling put options (Short Put): Simultaneously sell 1 deep out-of-the-money OTM Put with the same expiration date and a Delta of about -0.2 (for example, a strike price 15%-20% lower than the current price).
3.2 Recommendation logic: Using 'volatility inversion' to reduce costs and improve efficiency
Offsetting expensive Theta decay: As shown in the second part of the data, the current near-term options have extremely high IV, indicating that the time value loss of options (Theta Decay) occurs very rapidly. By selling deeper out-of-the-money puts, we can recover part of the premium, significantly reducing the holding costs of hedging positions.
Avoiding IV drop risk: The current VRP space is narrowing. Once the tariff ruling is finalized or macro sentiment stabilizes, IV may experience a Volatility Crush. The bear put spread strategy leverages the relative changes in IV between two strike prices through a buy-sell combination, effectively resisting the collective drop in Vega dimensions that could harm positions.
Precise protection for 'black swan' intervals: Considering BTC's lag in the first phase of risk assets during hedging, this strategy can provide a clear safety cushion for accounts. Even if a systemic liquidation occurs, triggered by events like a Federal Reserve leadership change, this strategy can still offer robust payouts within a locked price range.
3.3 Practical reminders
Compared to simply holding coins, bear put spreads perform excellently in a fluctuating downward market. If BTC prices maintain volatility in late February (before the mid-term election topics ferment), the maximum loss of this strategy is limited to the net paid premium. However, once a 'black swan' event triggers a deep correction, this strategy will provide valuable liquidity protection for spot positions.
IV, BTC & ETH
This report is based on publicly available market data and options theoretical models, aimed at providing investors with market information and professional analytical perspectives. All content is for reference and communication only and does not constitute any form of investment advice. Cryptocurrency and options trading carry high volatility and risks, which may lead to total loss of principal. Before adopting any trading strategy, investors should fully understand the characteristics, risk attributes of options products, and their own risk tolerance, and must consult professional financial advisors. The analysts of this report do not bear responsibility for any direct or indirect losses arising from the use of this report's content. Past market performance does not predict future results; please make rational decisions.
Co-produced by: Sober Options Studio × Derive.XYZ