

ZRO/USDT Perpetual · Binance · 15-Minute Chart · August 23, 2026
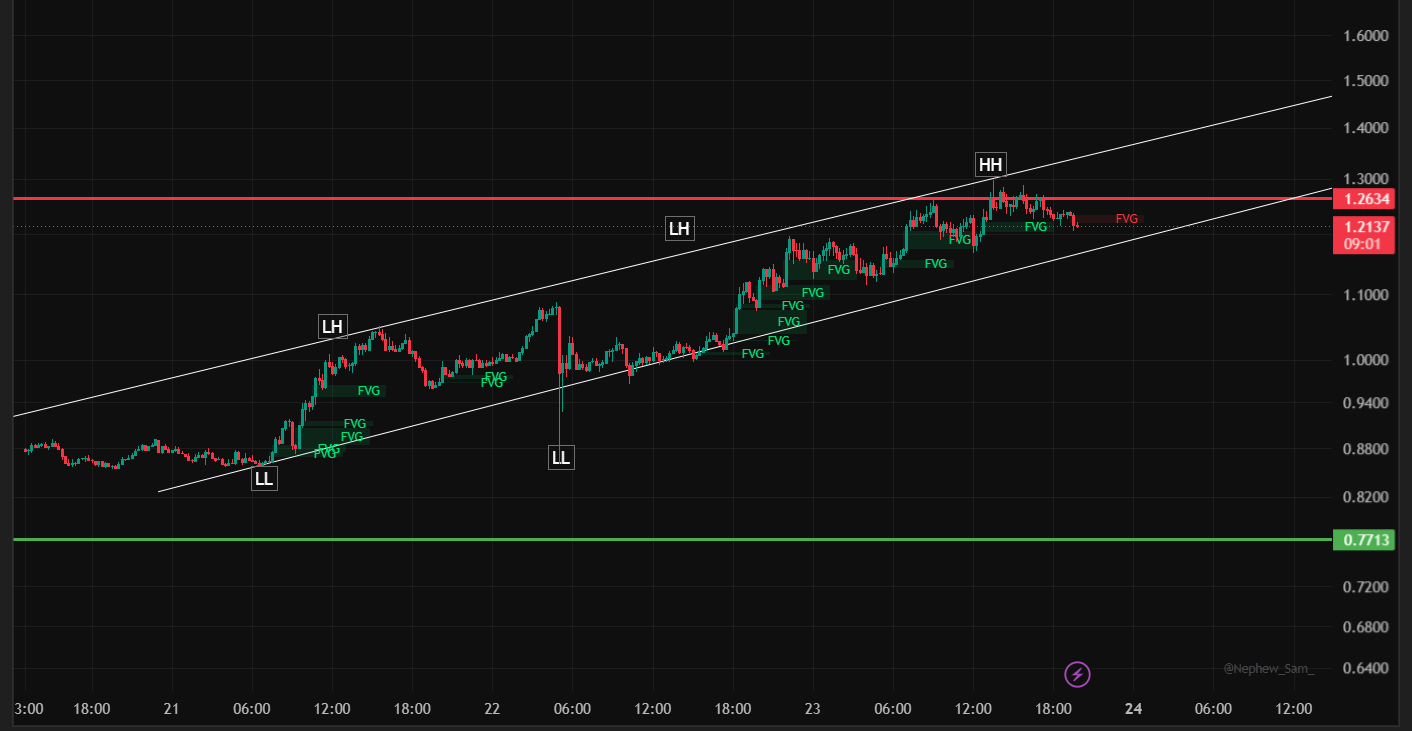
ZRO has been on a steady grind higher over the past few days, methodically working through a series of Fair Value Gaps on its way to a brand-new local high. After tagging that high, price has slipped back slightly into the most recent supply zone — a very normal pause after a strong impulsive run. The question now is whether this is healthy consolidation before another leg up, or the first sign that buyers are running out of steam.
The Structure So Far
The move began with a lower low (LL) near 0.85, followed by a lower high (LH) around 1.05 as the first bounce attempt.
A sharp flush produced a second lower low (LL) near 1.02, tagging a long lower wick before buyers stepped back in decisively.
From that low, ZRO rallied hard into a lower high (LH) near 1.19, leaving behind a dense stack of Fair Value Gaps on the way up — a sign of strong, sustained demand rather than a thin, low-conviction move.
That rally continued straight through to a higher high (HH) at 1.2634, the current swing high and the dominant resistance level on the chart.
Since tagging that high, price has pulled back modestly into the most recent FVG shelf and is now consolidating just under the high, currently trading around 1.2139.
Zooming out, there's also a major structural support far below at 0.7713 — a level that would only come into play on a much deeper, trend-changing move, but it remains the macro line in the sand for the broader structure.
Key Levels to Watch
Resistance:
1.2634 — the current higher high (HH) and the level buyers need to clear and hold above for the uptrend to extend into price discovery.
Support:
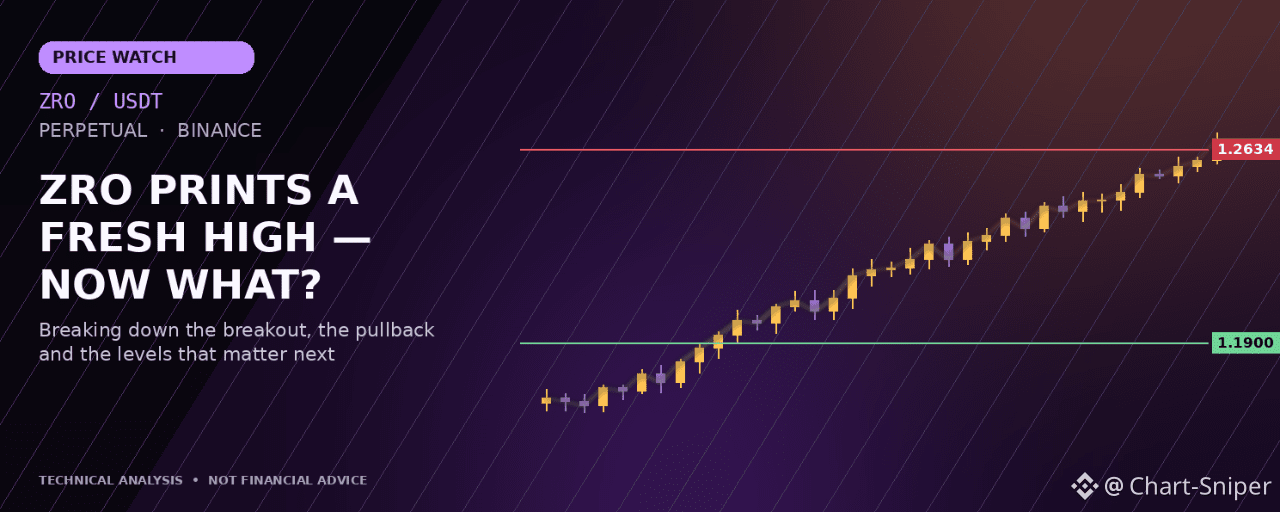
1.1900 — the upper edge of the recent Fair Value Gap cluster, the first real support beneath the current consolidation.
0.7713 — the deep structural support and macro invalidation level for the broader uptrend.
Trade Setups Worth Considering
1. Breakout-Continuation Long
Entry: On a confirmed 15-minute close above 1.2634.
Target: An extension move toward 1.35–1.40, based on the size of the prior impulsive leg.
Stop-loss: Below 1.1900, which would suggest the breakout attempt has failed and the range is reasserting itself.
2. Support-Bounce Long (buy the dip)
Entry: Scaling in within the 1.19–1.21 FVG shelf, where the recent pullback is finding footing.
Target: Back toward the 1.2634 high for the first leg.
Stop-loss: A close below 1.1700, which would open the door to a deeper retracement.
3. Fade-the-Resistance Short (counter-trend, higher risk)
Entry: On clear rejection wicks at or just above 1.2634 if price fails to close through it.
Target: Back down to the 1.19 FVG shelf.
Stop-loss: A close above 1.2800, since a strong close through the high invalidates the short thesis.
The Bottom Line
The density of Fair Value Gaps left behind on this rally is a constructive sign — it suggests the move up to 1.2634 has been driven by genuine, sustained buying rather than a thin spike. As long as price holds above the 1.19 shelf, the path of least resistance still favors a retest and eventual break of 1.2634. A decisive loss of that shelf, however, would be the first real signal that this leg has run its course and that a deeper pullback toward the mid-structure is underway.
Disclaimer: This article is for informational and educational purposes only and does not constitute financial, investment, or trading advice. Cryptocurrency derivatives, including perpetual contracts, are highly volatile and leveraged instruments that carry a significant risk of loss. Always conduct your own research and risk management, and consider consulting a licensed financial advisor before making any trading decisions.
@Binance Square Official #BitcoinStrongestWeekSinceMarch2023 #BPIUrgesFinCENExpandStablecoinIDRulesToSecondaryMarkets #AnthropicIPOCouldTopSpaceXRecordReportsSay #Binance #ChartSniper