$ETH $ETH
📊 Current Price Context
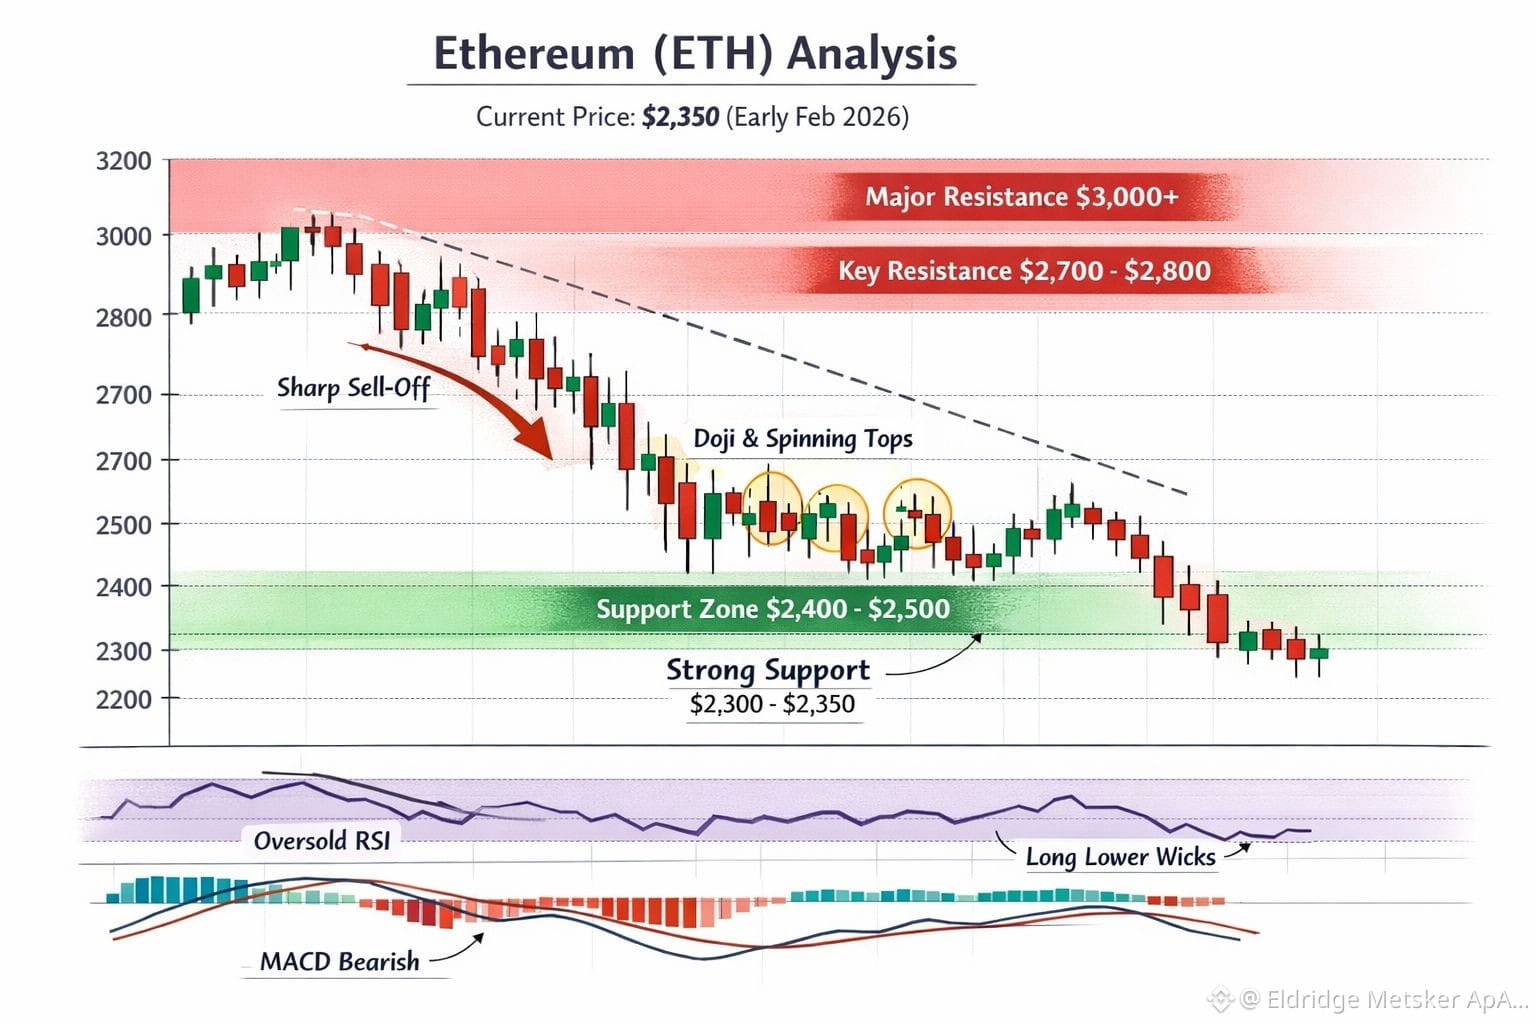
ETH is trading roughly around $2,300-$2,400 on major exchanges, with notable volatility and relatively wide daily ranges. Recent price action shows a meaningful drop from higher levels, and technical indicators across platforms mark a bearish setup overall.
📉 Candlestick Structure & Patterns
Daily Timeframe:
Recent daily candles showed sharp downward bodies, indicating sustained selling pressure. 🕯️
Some candles exhibit long lower wicks — meaning buyers stepped in near support zones, creating rejection tails. These often hint at temporary relief bounces.
Shorter Timeframes:
On 2-hour and 4-hour charts, mixed patterns like dojis and spinning tops appear, representing indecision between buyers and sellers following high volatility.
Trend Structure:
The sequence of lower highs and lower lows — especially in recent daily bars — signals that the short-term trend remains bearish until key resistance breaks.
📌 Key Levels to Watch (Candlestick-Driven)
Support Zones:
$2,400-$2,500 – nearby support where buyers have been absorbing selling pressure.
$2,300-$2,350 – deeper support from recent consolidation areas on the chart.
Resistance Zones:
$2,700-$2,800 – a key ceiling where several larger candle wicks have been repeatedly rejected.
$3,000+ – psychological resistance and a threshold where bullish candles would be needed to shift trend sentiment.
🔍 Technical Takeaways
Bearish Signals
Candlestick bodies trending downward with high response at resistance levels.
Many moving averages and momentum indicators on major chart services currently point to sell-side bias (RSI oversold, MACD below zero).
Bullish Potential
Oversold conditions in several oscillators may set the stage for relief rallies, especially if wide-range candles form near strong support.
A daily close above the $2,800-$3,000 corridor would likely shift sentiment and candlestick patterns toward a bullish trend context.