📉 ETHEREUM CONSOLIDATES AFTER HITTING HIGHS: BREATHE, THE MARKET! ⚡
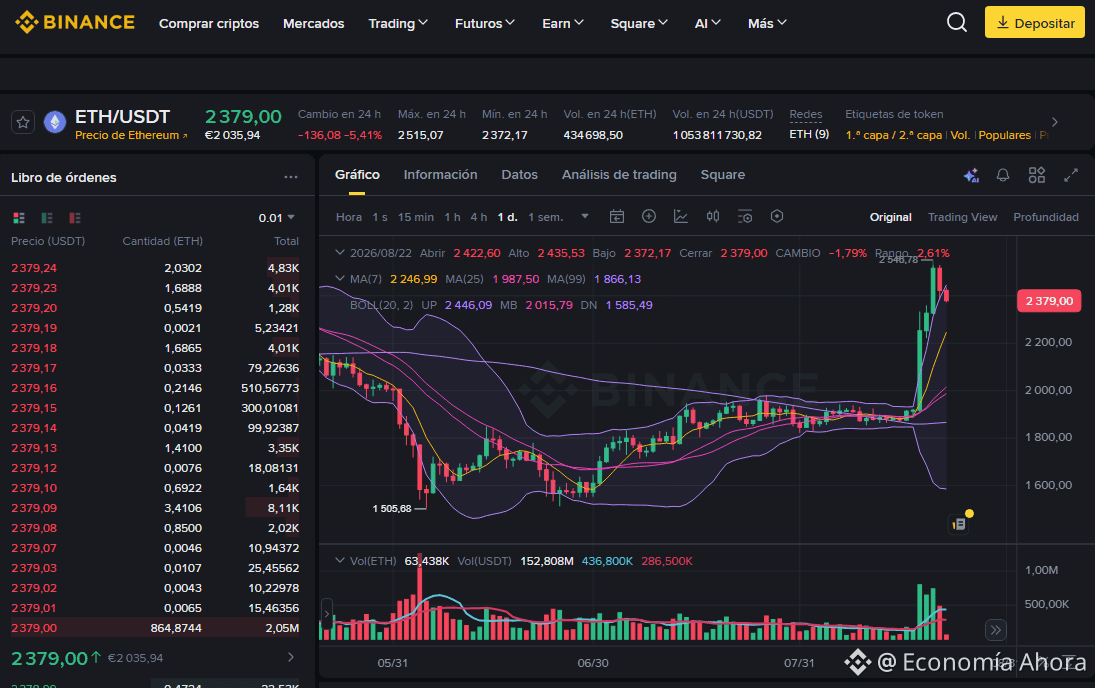
ETH/USDT’s daily chart shows a moderate technical correction, trading at 2,379.00 and recording a -5.41% pullback over the last 24 hours. Its daily trading range reached a maximum of 2,515.07 and a minimum of 2,372.17, reflecting a logical cooling-off phase and profit-taking after testing higher resistance zones.
🔍 Trend Analysis and Indicators
Trend: Bullish short-term consolidation. Despite the daily drop, the price remains comfortably above the fast moving average MA(7) (2,246.99), MA(25) (1,987.50), and MA(99) (1,866.13).
Bollinger Bands: The price retreats from the upper area and seeks to stabilize after the strong prior impulse. The upper band is at UP: 2,446.09, the middle line at MB: 2,015.79, and the lower band at DN: 1,585.49.
Structural Floor: The fundamental technical support that firmly established the base of the previous trend remains solidly set at 1,505.68.
💡 Trading Strategy: Buy or Sell?
Buy (Long)?: This healthy pullback offers a more cautious tactical opportunity to look for staggered entries, avoiding buying at absolute highs. Management: It is strictly mandatory to use a rigorous Stop Loss to protect capital against any extension of the correction.
Sell (Short)?: A high-risk counter-trend trade, since the main structure continues to respect the bullish macrotrend. It would only be considered under a deep invalidation of supports.
#ETH #AnalisisTecnico #CryptoTrading
The Lord blesses and prospers whoever operates here, in the name of Jesus, because your word says: “Mine is the silver, and mine is the gold,” says the LORD of hosts.” Hageo 2:8 RV1960-T -
$ETH
ETH/USDT’s daily chart shows a moderate technical correction, trading at 2,379.00 and recording a -5.41% pullback over the last 24 hours. Its daily trading range reached a maximum of 2,515.07 and a minimum of 2,372.17, reflecting a logical cooling-off phase and profit-taking after testing higher resistance zones.
🔍 Trend Analysis and Indicators
Trend: Bullish short-term consolidation. Despite the daily drop, the price remains comfortably above the fast moving average MA(7) (2,246.99), MA(25) (1,987.50), and MA(99) (1,866.13).
Bollinger Bands: The price retreats from the upper area and seeks to stabilize after the strong prior impulse. The upper band is at UP: 2,446.09, the middle line at MB: 2,015.79, and the lower band at DN: 1,585.49.
Structural Floor: The fundamental technical support that firmly established the base of the previous trend remains solidly set at 1,505.68.
💡 Trading Strategy: Buy or Sell?
Buy (Long)?: This healthy pullback offers a more cautious tactical opportunity to look for staggered entries, avoiding buying at absolute highs. Management: It is strictly mandatory to use a rigorous Stop Loss to protect capital against any extension of the correction.
Sell (Short)?: A high-risk counter-trend trade, since the main structure continues to respect the bullish macrotrend. It would only be considered under a deep invalidation of supports.
#ETH #AnalisisTecnico #CryptoTrading
The Lord blesses and prospers whoever operates here, in the name of Jesus, because your word says: “Mine is the silver, and mine is the gold,” says the LORD of hosts.” Hageo 2:8 RV1960-T -
$ETH