
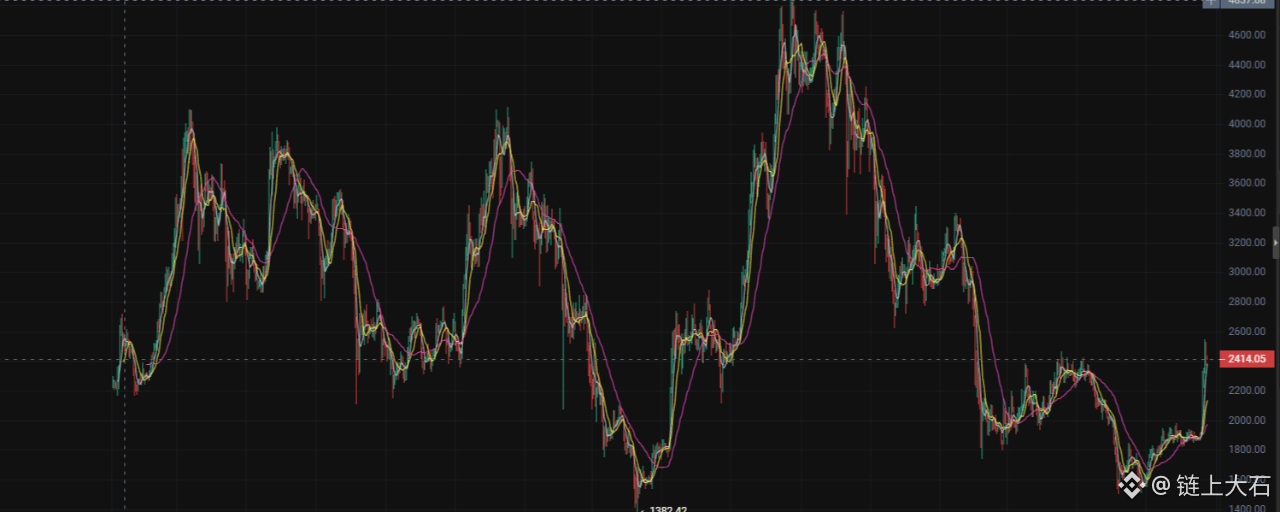

Today is August 23, $ETH current price 2418.27. Judging from the recent market structure, ETH previously went through a very strong rebound: the price quickly moved away from the low zone and regained the $2,300 level. It has now entered a phase of high-level contention. Recent technical analysis shows that ETH’s short-term momentum remains relatively strong, but the daily RSI is already in a clearly overbought area. This means that although the upward momentum is strong, the risk of a short-term pullback is increasing at the same time.
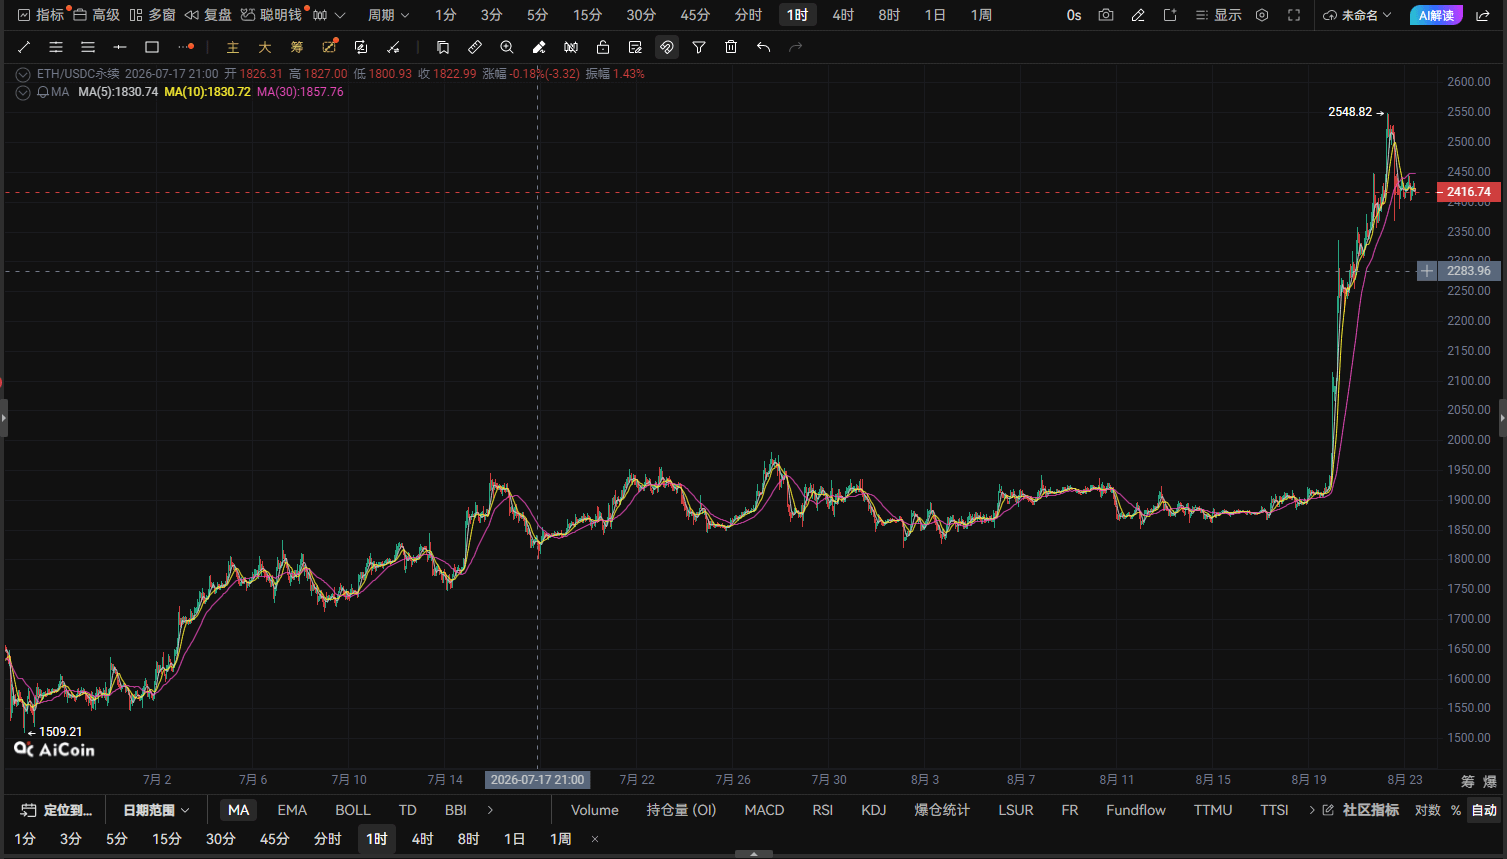
1-hour chart: After the spike, there’s a lack of follow-through; the short-term window for switching between long and short is underway.
According to the K-line chart, after ETH made a continuous push higher previously, the price clearly showed a slowdown above $2,400. The current level around $2,418 is in the short-term high zone.
On the 1-hour timeframe, the most worth watching is whether price can continue increasing its volume after making a new high. If price keeps ranging in the 2400—2430 area but keeps failing to break through, this kind of move is very likely to turn into short-term longs taking profits.
Currently shorting around 2418. Fundamentally, this isn’t blindly trying to top; it’s about betting on the pullback space after a rally and spike. First, watch the area around 2390; next, watch around 2370. If 2400 is lost, the advantage for short positions in the short term will expand further.
Therefore, the main focus today on the 1-hour timeframe is: the 2400 level—whether it holds or breaks. If it can’t stand above, shorts have an opportunity; if it breaks out again with increased volume above 2430, then the short-selling idea needs to be handled with caution.
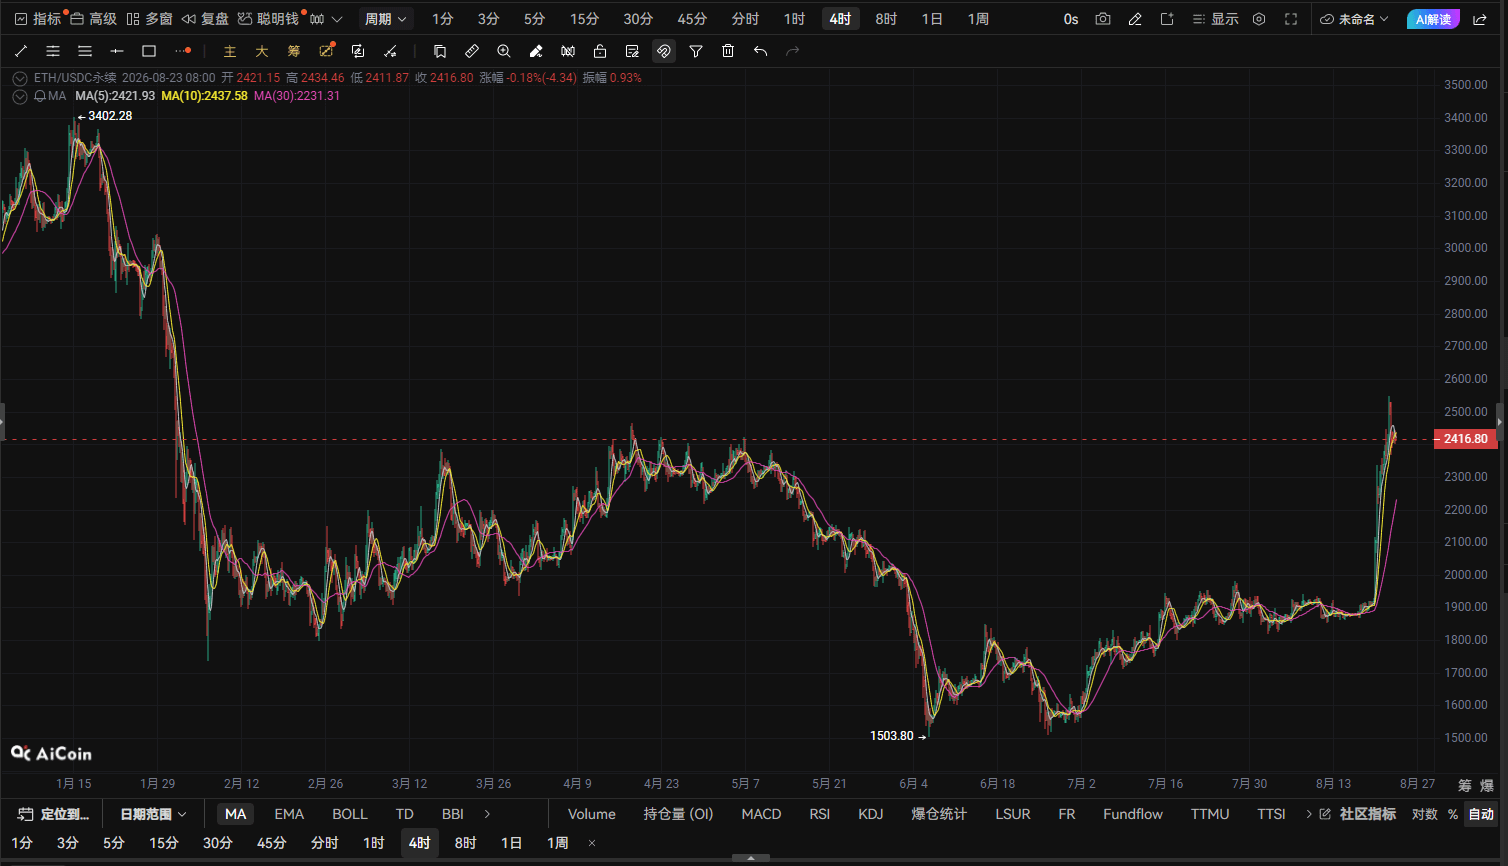
4-hour chart: after a big surge, momentum is overheated, and pullback demand is increasing
On the 4-hour timeframe, ETH has rebounded steadily from around $1900 in the earlier phase, and it has already moved above $2400. Public technical analysis shows that ETH has already moved above the 20-, 50-, 100-, and 200-day moving averages, so the overall trend is still relatively strong. However, the price has pulled noticeably away from some of these moving averages.
This is the core contradiction of the current order book:
The trend is bullish, but the price position is already quite elevated.
The 4-hour timeframe isn’t about calling the overall trend bearish. It’s about judging whether the short-term rally is so fast that profit-taking needs to be released. The 2400—2450 area is a key resistance band right now. If price keeps striking it but can’t break through, short-term technical pullbacks are very likely.
First, watch the 2370—2380 zone below; if it goes further, then watch 2320—2340. As long as after the pullback price regains acceptance/support, ETH’s medium-term trend will not be easily changed.
Therefore, today the 4-hour timeframe is more suitable for taking short positions on a high-level pullback, rather than interpreting a short at the short term as a trend reversal.
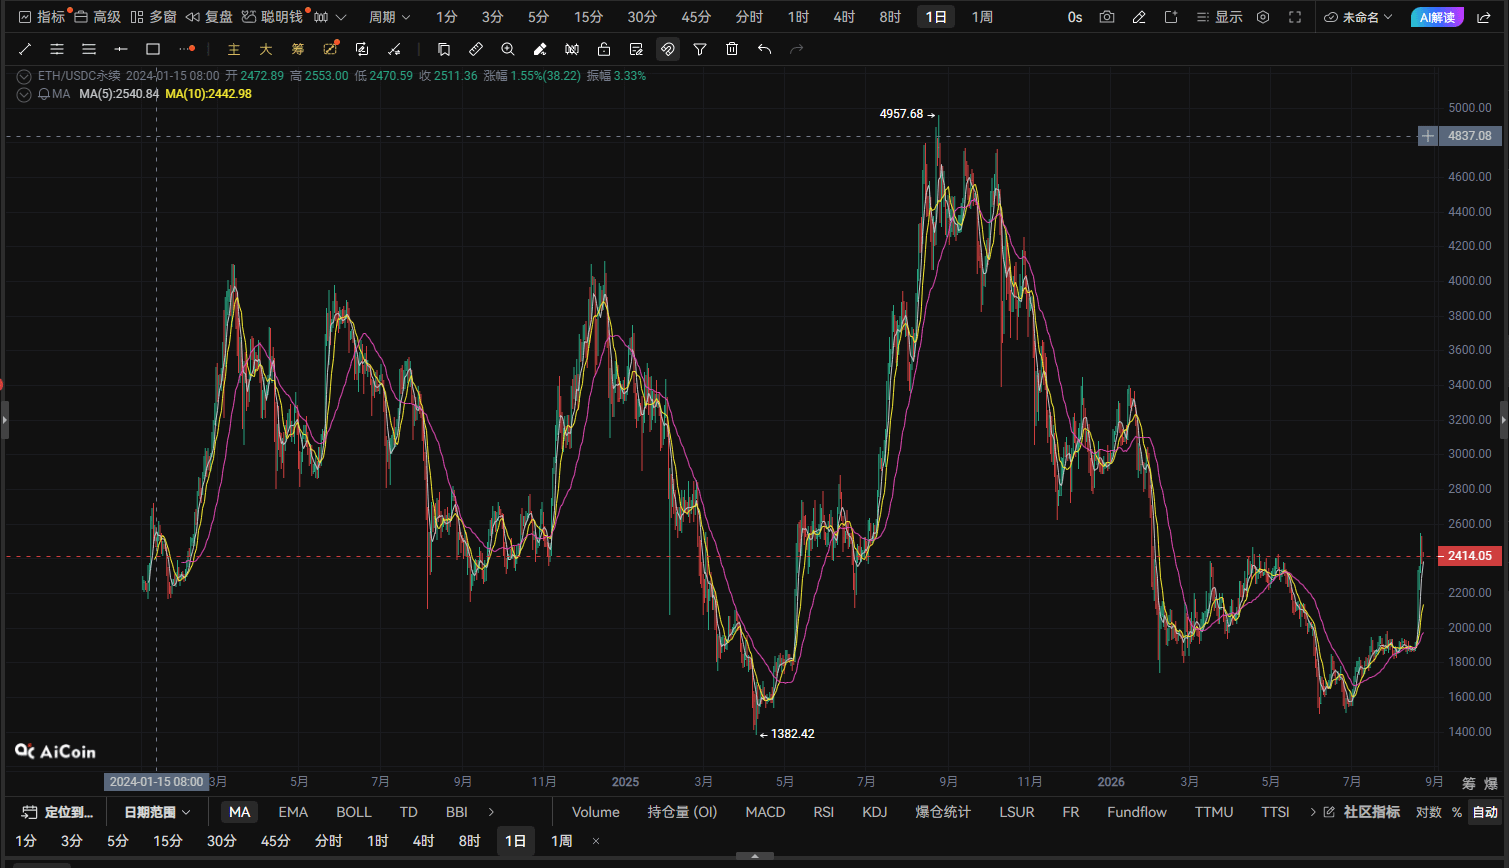
Daily chart: indicators are overheated—be cautious of “rising too fast” in the short term
The daily timeframe is the most important basis for today’s short-selling logic.
Recently, ETH has completed a very clear trend repair: it has broken back above $2000 and the long-term moving average pressure. The latest technical analysis shows that on the daily chart, the 14-period RSI for ETH briefly reached around 84 earlier, which is a very obvious overbought zone. At the same time, MACD is still holding strong, indicating that the big-picture trend hasn’t turned bearish; but in the short term, price has entered a high-level digestion phase.
Here, you must make it clear:
Overbought RSI ≠ an immediate crash, but it means the risk-reward for chasing rallies is declining.
After the price quickly rallies, if at high levels you see consecutive small real-body candlesticks, the upper wicks increase, and the trading volume can’t continue expanding, it often signals that short-term funds are starting to take profits.
So my current daily-chart judgment is: the larger timeframe is still relatively strong, but the smaller timeframe has pullback needs.
That’s also why I chose to short in the short term today, instead of directly turning bearish on the long-term trend.
Trading plan for today
Looking at the three timeframes—1-hour, 4-hour, and daily—ETH is currently in a high-level consolidation phase after a strong trend.
On the upside, focus on the 2430—2450 zone; whether it can break out with volume will determine the subsequent upside space for longs. On the downside, focus on 2400, 2370, and 2340.
Today’s core strategy can be summarized in one sentence:
Don’t chase longs at high levels—buy rallies and then fade when it pulls back. If it drops, look for support; if it breaks down, look for continuation.
If there is clear pressure around 2400, shorts can continue to monitor the downside space below. If price strongly breaks above 2450 and holds, then it means the short thesis has failed and you must strictly execute the stop-loss.
The stronger the market, the easier it is to create the illusion of “only going up, never down.” True professional trading, however, is precisely staying calm when the market is most euphoric.
Live trade | Open the position directly at the current price
Trading instrument: ETH
Direction: Short
Entry price: 2418.27
Stop-loss: 2454.54
First take-profit: 2394.09
Second take-profit: 2370.00
This is a high-level pullback setup. Pay close attention to the support strength around the 2400 psychological level. If price breaks below 2400 and continues to face heavy selling pressure, the downside space for shorts may open up further. If it strongly breaks through 2450, then strictly execute the stop-loss.
Watch the trend, but even more watch the position. Be bold to act, but also be bold to admit mistakes. Profit comes from judgment; survival comes from discipline.