How important is the Fibonacci retracement level of 0.618? | Technical Indicator Learning Series
A chart that helps you understand the upward trend from $74,415 to $105,771 in the last round and the practical application of Fibonacci retracement levels
Practical application of Fibonacci
First, I need to help you understand what Fibonacci retracement lines are and why 99.99% of professional traders in the market use them.
Fibonacci retracement lines are based on a set of 'golden ratios': 0.236, 0.382, 0.5, 0.618, 0.786 (sometimes also including 0.886 and the symmetrical position of 1.618)
These points reflect the potential support/resistance after a price pullback from a high-low range, commonly used to identify: pullback buy points | rebound short points | long-short conversion zones (0.5 and 0.618)
-----------------------------------------------------
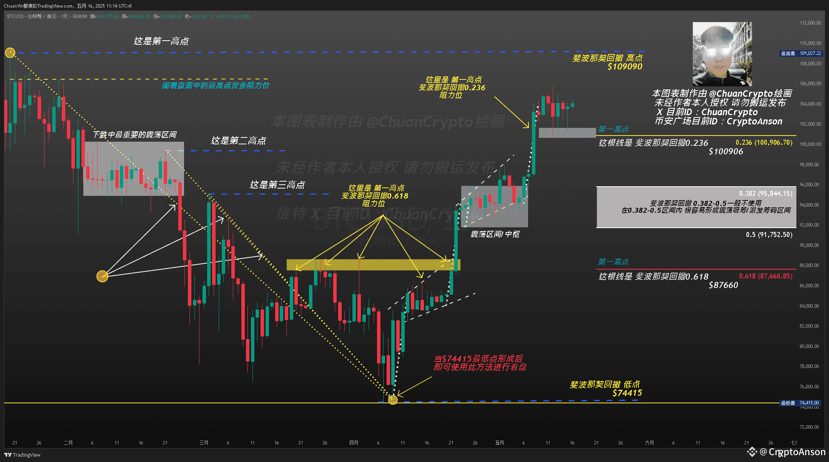 This chart shows $BTC From January 20, 2025 to May 16, 2025, a rebound from the low of $74,415 to the high of $105,771. We focus on the retracement—accumulation—breakout phase.
0.618--Retracement at 87,660 is the golden retracement level, the most commonly defended support level by major players; the rebound starting point in the chart is exactly around this area.
0.5--Retracement at 91,752, mostly a consolidation range, with frequent short-term price fluctuations; no obvious support or resistance.
0.382--Retracement at 95,844, a neutral resistance level, often encountering pressure during pullbacks; easily forms rebound highs or consolidation tops.
0.236--A strong rebound resistance level at 100,906 after a retracement, with increasing divergence between bulls and bears; indeed, there have been multiple resistance encounters in the chart.
First high point--the previous high resistance at 109,090 is the endpoint of the last market; it is a very strong pressure area, and attention should be paid to the volume breakthrough confirmation (generally, the previous high area is a strong asset position that is difficult to break through).
Practical operation process (arranged by timeline).
1-- Identify the low point ($74,415).
The price bottom formation is complete, and a signal to stop falling appears (bullish engulfing, large bullish candle, volume), indicating a possible initiation of a main upward wave; record this low point as the starting point.
2-- Prepare to enter a long position after the price rises to $87,650.
The market bottom has successfully formed; pay attention to the price direction on the order book and buy a portion of long positions in advance on the left side.
After breaking resistance, add to long positions according to a phased or full position strategy, taking partial profits or stopping out and observing when the price rises to 0.5-0.382.
Practical trading advice.
Place limit long orders in the range of $87,800–$88,000.
Stop loss setting: $85,800–$86,000 (if it breaks below 0.618, the trend is questionable).
Target 1: $95,000 (0.382)
Target 2: $100,000 (0.236)
-----------------------------------------------------
3-- After the rebound to $95,844, it oscillates, with increasing competition between bulls and bears, slowing down, and is in the range of 0.382 – 0.5; the technical aspect does not recommend big movements.
Practical trading advice.
Hold positions without adding, and set a breakeven stop profit.
Wait for the price to break above $96,000 before deciding whether to go long.
If it falls below $91,700, consider stopping profits and waiting for a chance to buy low again.
-----------------------------------------------------
4-- A strong breakthrough at resistance $100,906 with a strong bullish candle, successfully standing above the 0.236 retracement level, restoring market confidence in bulls.
Trading advice: If the previous long position is still open, move the stop loss to around $96,000 to lock in profits. If flat, a small position can be added to go long, targeting the previous high of $109,000, with a stop loss around $99,500.
-----------------------------------------------------
In summary, in the practical application of Fibonacci retracement lines: '0.618 is the golden ticket to get on board, 0.382 is the test of volatility, 0.236 determines whether to restart the offensive, and the previous high is the gatekeeper of bull and bear transitions.'
OK... The article ends here. From the author's perspective, Fibonacci retracement holds an irreplaceable importance in the hearts of technical traders. How a novice trader can reasonably utilize Fibonacci retracement and set up a trading system tailored to their trading style is paramount.
At the end of the article, I would like to send a message to the readers of this article: 'Be friends with the market, accompany the trend.' Thank you all for reading and for the support from fans.