
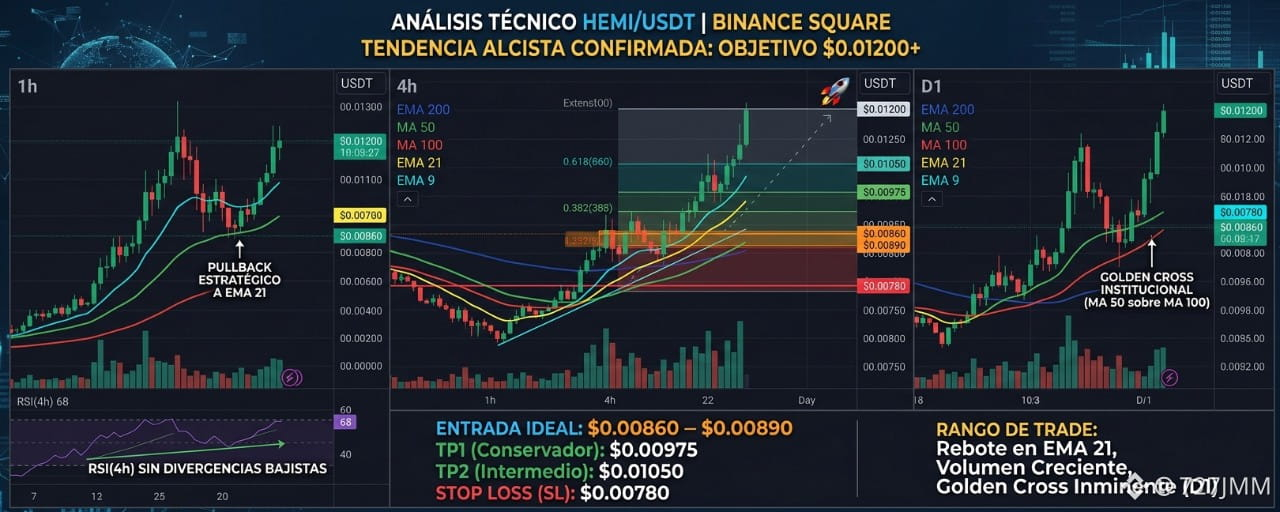

After decisively breaking a prolonged accumulation phase at the macro level, the HEMI/USDT chart confirms a clear bullish trend. On timeframes of 1h and 4h, price action remains solid above the 200 EMA, validating it as our steel support. Currently, the EMA 9 is aggressively leading over the EMA 21, while on the daily chart a Golden Cross is taking shape (the institutional cross of the 50 MA over the 100 MA), injecting a great deal of confidence into the market. Meanwhile, the RSI (4h) is around 68 points; although it is approaching overbought conditions, it does not show bearish divergences, and the increasing buying volume legitimizes the validity of each upward candle.
Trade Setup Configuration:
Ideal entry zone: $0.00860 – $0.00890 (Optimal confluence level of technical signals and Fibonacci support at 0.382).
Tp1 (Conservative): $0.00975 (Take profit at the recent local high to secure gains).
Tp2 (Intermediate): $0.01050 (Technical resistance block and an important psychological level).
Tp3 (Moonshot): $0.01200 (Fibonacci extension 1.618; extended target if FOMO and the trend persist).
Stop Loss (SL): $0.00780 (Required technical invalidation level. This is where the 50 MA support breaks and we lose the structure of higher lows).
Trade Range: We are entering in a calculated way by trading the strategic pullback. The buy trigger activates with a precise bounce projected on the 21 EMA on the 1h timeframe, at the exact moment when the RSI has exited the exhaustion zone after cooling off the previous momentum. As this area converges with key dynamic support levels and a high volume of buy intent, we obtain an institutional-grade risk/reward equation. We go in favor of market strength to target the upper liquidity.