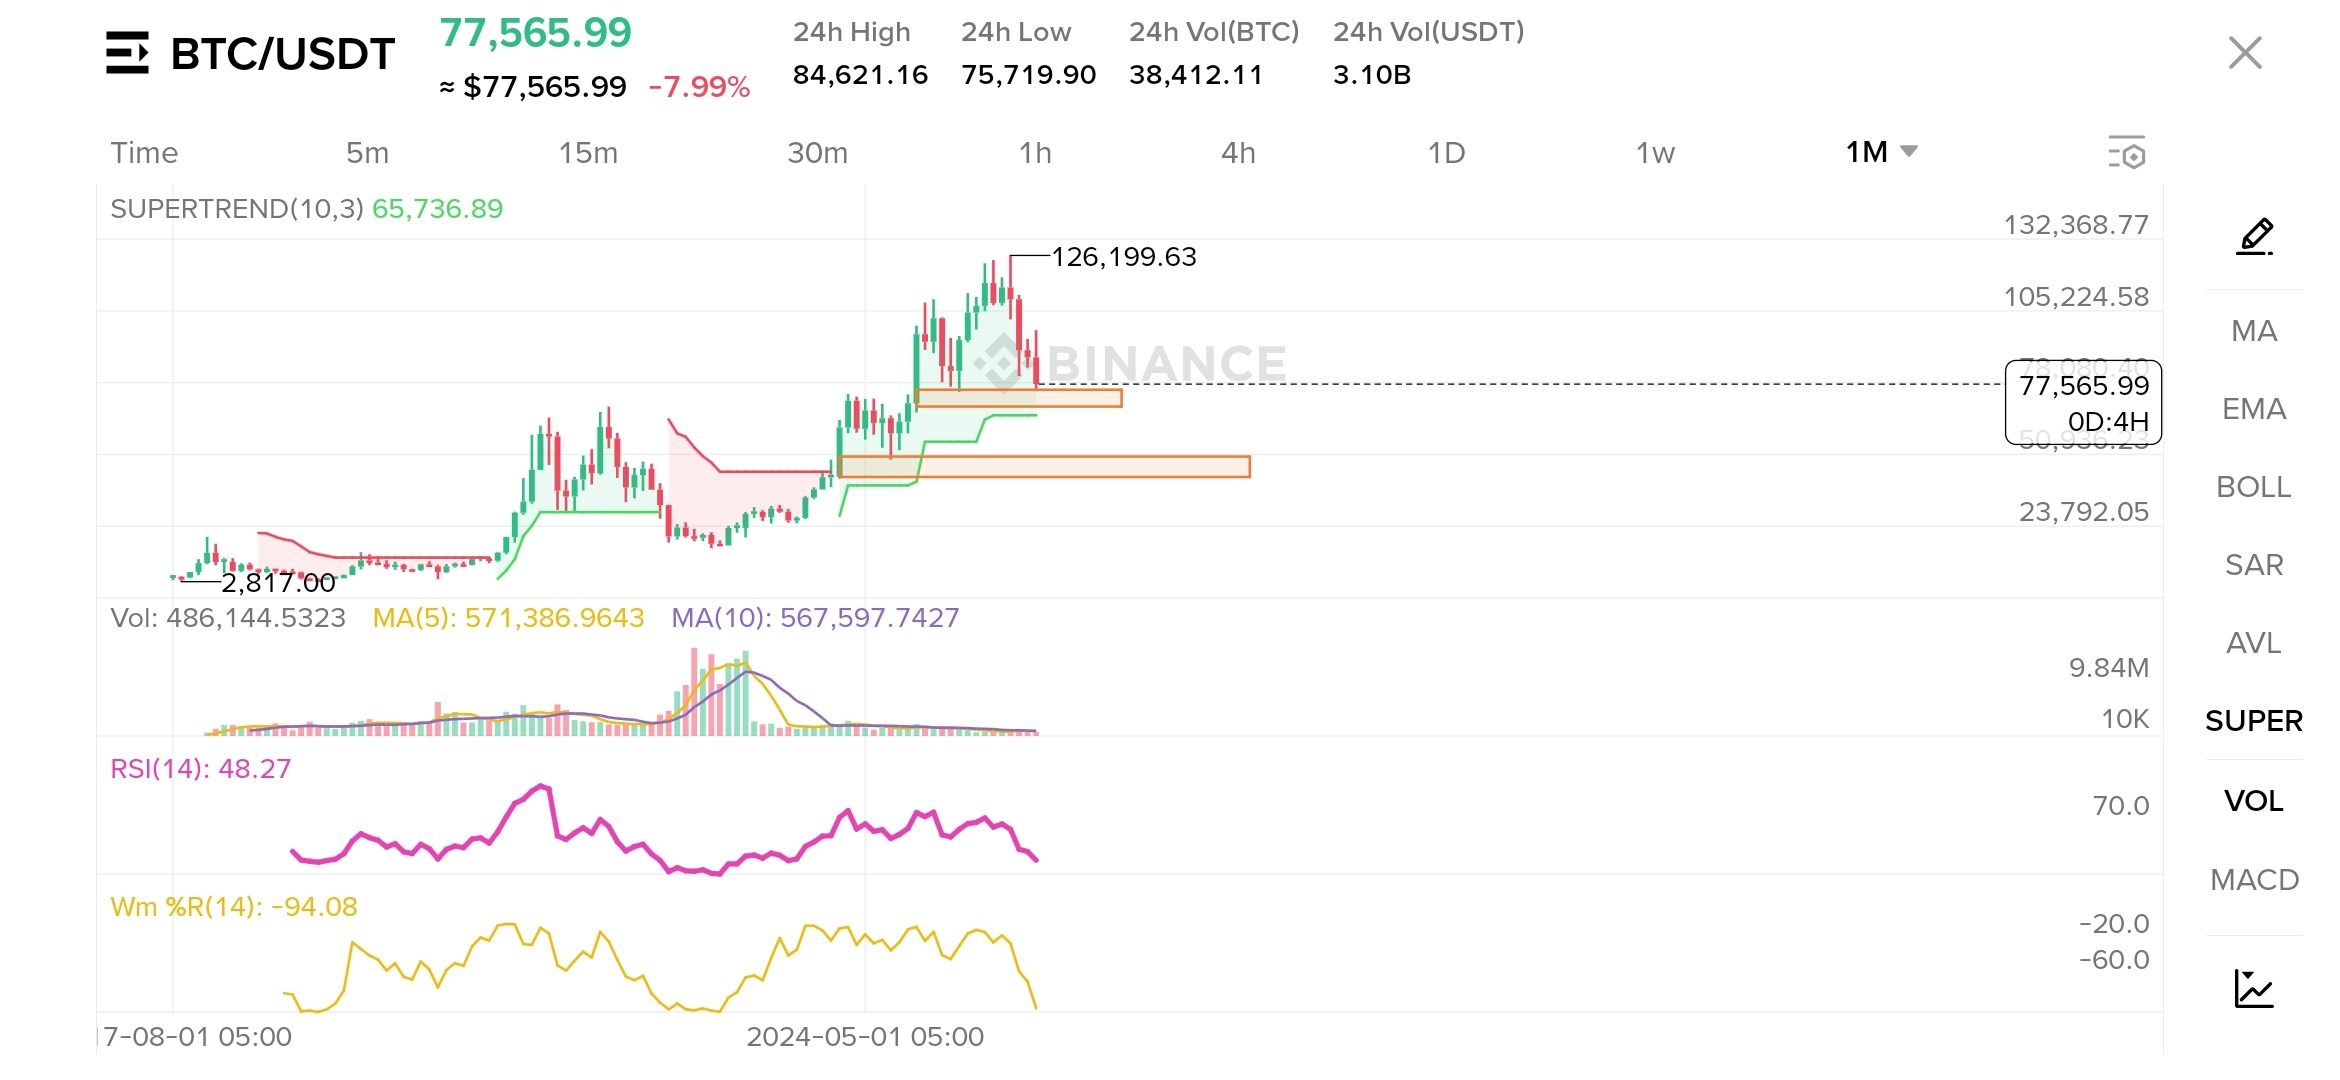
📌 FVG #1 – Upper Monthly FVG (Mid Support Zone)
According to Chart Points:
This FVG was formed after a strong bullish impulse
Price has not been properly tested in this zone
After rejection, BTC is trading above this area
Technical Points:
📍 This zone can become a short-term monthly support
📍 If the price consolidates here, the next bullish leg is possible
📍 The formation of long wicks within this FVG will indicate the presence of buyers
Trading Insight:
✔️ For bullish continuation
→ It is essential for the monthly close to remain above this FVG
❌ Strong close below this zone
→ The test of the lower FVG is almost confirmed
📌 FVG #2 – Lower Monthly FVG (Major Demand Zone)
According to Chart Points:
This FVG is built on the previous accumulation phase
A strong rally started before this zone
This area is the base of the long-term structure
Technical Points:
📍 Upon entering this FVG, the market will be in deep correction mode
📍 Historically, institutional buying is expected from here
📍 If this zone breaks, the macro trend will become seriously weak
Trading Insight:
✔️ For long-term investors
→ Best risk-to-reward accumulation zone
❌ Monthly close is below
→ Bear market confirmation may be possible
📊 Indicators (According to the chart)
RSI (14): ~48
Neutral to bearish side
Not overbought → space for correction available
Williams %R: Near oversold
Short-term relief bounce possible
But the monthly trend is not fully bullish yet
Volume:
Recent candles show more selling pressure
Buyers are still in defensive mode
🧠 Market Structure Summary (Chart-Based)
🔸 Strong rejection at high → signal of distribution
🔸 Price will now respect imbalance zones (FVGs)
🔸 The trend has now entered the range + correction phase
✅ Final Conclusion (Considering the chart)
BTC's monthly chart clearly shows that:
📌 The market will not go straight up
📌 First FVGs will fill or be respected
Roadmap:
Upper FVG hold → bullish continuation possible
Upper FVG break → lower FVG test highly probable
Lower FVG hold → long-term bullish structure safe
📢 Smart traders are those who do not follow the price,
but rather follow liquidity and imbalance.