
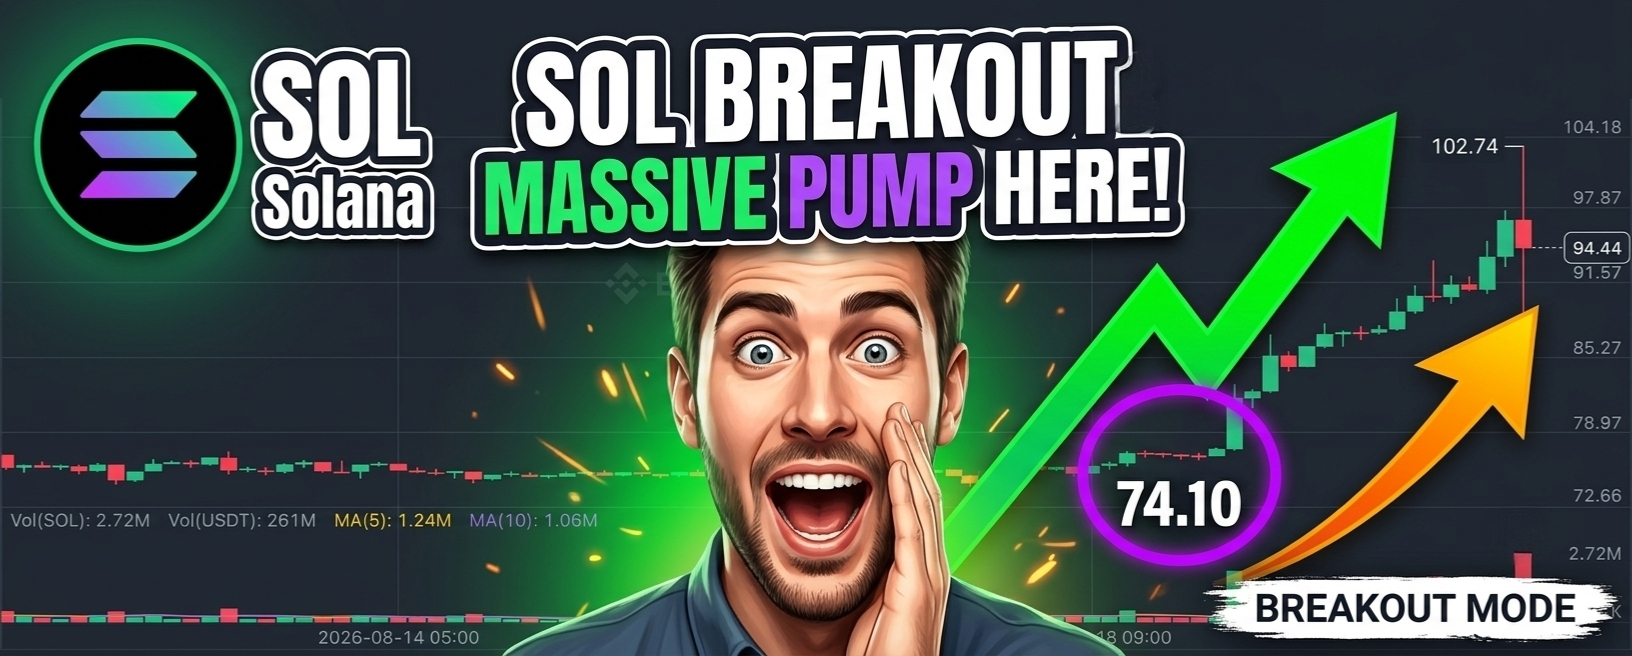
Recent momentum has cooled, and price is now hovering near a level that has previously determined the next trend direction.
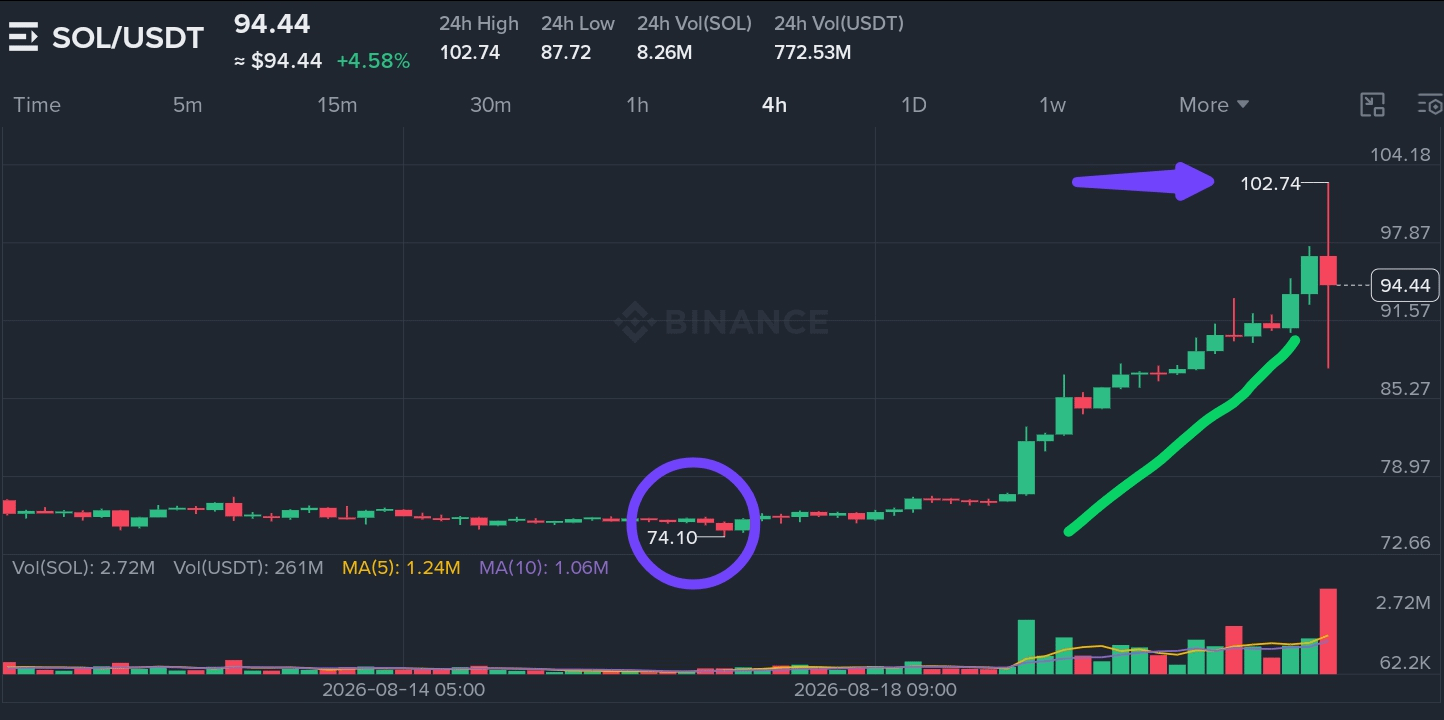
The 4-hour chart shows a strong recovery from the $72.66 swing low, with price climbing through $78.97 and $85.27 before reaching a high of $104.18. The rejection from that area was sharp, pulling price back to $94.44. Currently, price is consolidating above $91.57, which has become a support level to watch. The 24-hour volume of 8.26M $SOL indicates active participation, with significant buying interest evident during the rally.
This matters because the $104.18 area has previously capped upside attempts. A confirmed move above this level would signal a potential continuation, while a sustained rejection would indicate that sellers remain active at higher levels. The $91.57 level has provided a floor during the recent pullback, making it a key reference point for the current structure. The 24-hour volume of 772.53M USDT indicates substantial market interest and liquidity.
Support: $91.57
Major support: $85.27
Resistance: $97.87
Major resistance: $104.18
Confirmation Zone: The $91.57 to $94.44 area could be watched as a potential reaction zone if support holds and price shows acceptance above $91.57 with a 4-hour close.
Potential Target: If price reclaims $97.87 and holds, the next resistance near $104.18 would be a potential target zone.
Setup Fails If: A sustained 4-hour close below $91.57 would invalidate this educational setup.

One key lesson here is the concept of false breaks versus genuine reversals. A wick below support followed by a quick recovery often traps sellers who panic at the wrong moment. Conversely, a clean close below support confirms that sellers have taken control. This distinction is critical when approaching levels like $91.57, where buyers have previously stepped in.
If price holds above $91.57 and reclaims $97.87, the next resistance near $104.18 would come into focus, potentially opening the door to higher levels. A clean break above $104.18 would signal a shift in momentum and a potential continuation of the uptrend.
If $91.57 fails with sustained selling pressure, the structure would weaken significantly, and price could search for support near $85.27. Repeated rejection below $97.87 would confirm that sellers remain active near that zone.
A sustained 4-hour close below $91.57 would invalidate the current support thesis. Until then, the area between $91.57 and $97.87 remains the primary decision zone. Watch for a clean close above $97.87 to confirm strength, or a close below $91.57 to signal further downside.
Are you watching for a breakout above resistance or a pullback to lower levels?
Educational only. Not financial advice. Manage risk.