🚨 The trap of traditional indicators in the HMSTR coin.. where do the whales really hide?
If you only rely on the classic "RSI" or "MACD" indicators to judge the direction of the HMSTR (Hamster Kombat) coin, you’re often reading the market with one eye!
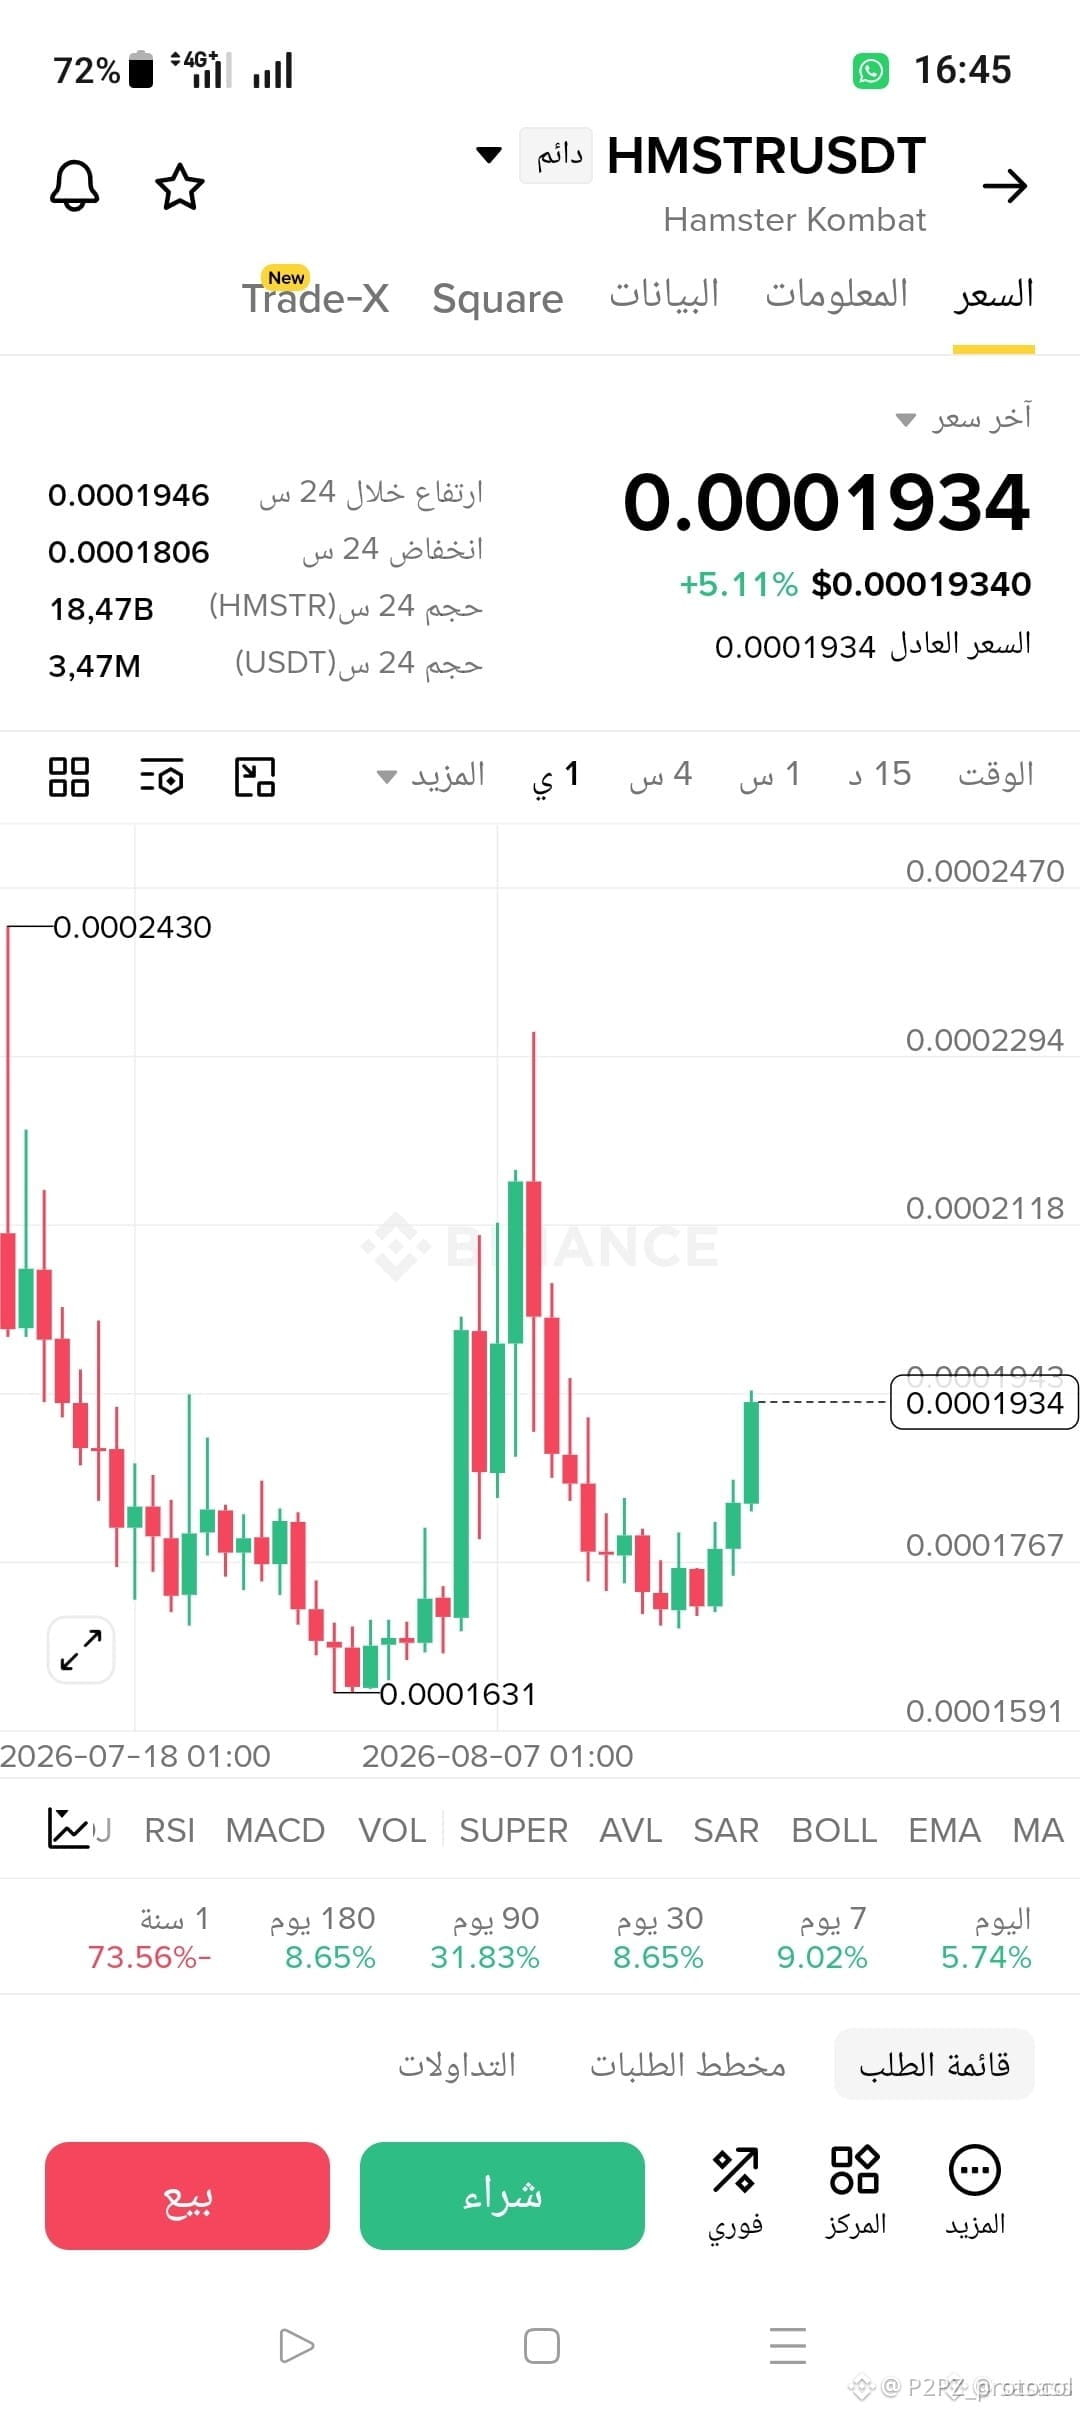
While the main charts show deceptive stability or occasional sideways movement around 0.0001934 after rebounding from the 0.0001631 bottom, the liquidity flow map and whale orders reveal a completely different scenario:
Silent accumulation: the whales absorb liquidity quietly under individual traders’ radar to avoid triggering early price excitement.
Reversal trap: technical indicators look neutral or suggest overbought/oversold conditions, but the Order Books point to the buildup of a massive buy wall.
Next target: the upcoming breakout may aim to retest previously high-liquidity zones while ignoring the classic bearish signals.
Golden rule in trading: traditional indicators are designed to tell you what happened, while tracking whales tells you what will happen before it occurs!
Share your opinion in the comments:
Do you notice the same suspicious behavior from market whales in your wallets right now, or do you prefer waiting until the technical pattern fully completes?
$HMSTR
#BinanceSquare #HMSTR #حركة_الحيتان #تحليل_فني_SOL #العملات_الرقمية
If you only rely on the classic "RSI" or "MACD" indicators to judge the direction of the HMSTR (Hamster Kombat) coin, you’re often reading the market with one eye!
While the main charts show deceptive stability or occasional sideways movement around 0.0001934 after rebounding from the 0.0001631 bottom, the liquidity flow map and whale orders reveal a completely different scenario:
Silent accumulation: the whales absorb liquidity quietly under individual traders’ radar to avoid triggering early price excitement.
Reversal trap: technical indicators look neutral or suggest overbought/oversold conditions, but the Order Books point to the buildup of a massive buy wall.
Next target: the upcoming breakout may aim to retest previously high-liquidity zones while ignoring the classic bearish signals.
Golden rule in trading: traditional indicators are designed to tell you what happened, while tracking whales tells you what will happen before it occurs!
Share your opinion in the comments:
Do you notice the same suspicious behavior from market whales in your wallets right now, or do you prefer waiting until the technical pattern fully completes?
$HMSTR
#BinanceSquare #HMSTR #حركة_الحيتان #تحليل_فني_SOL #العملات_الرقمية