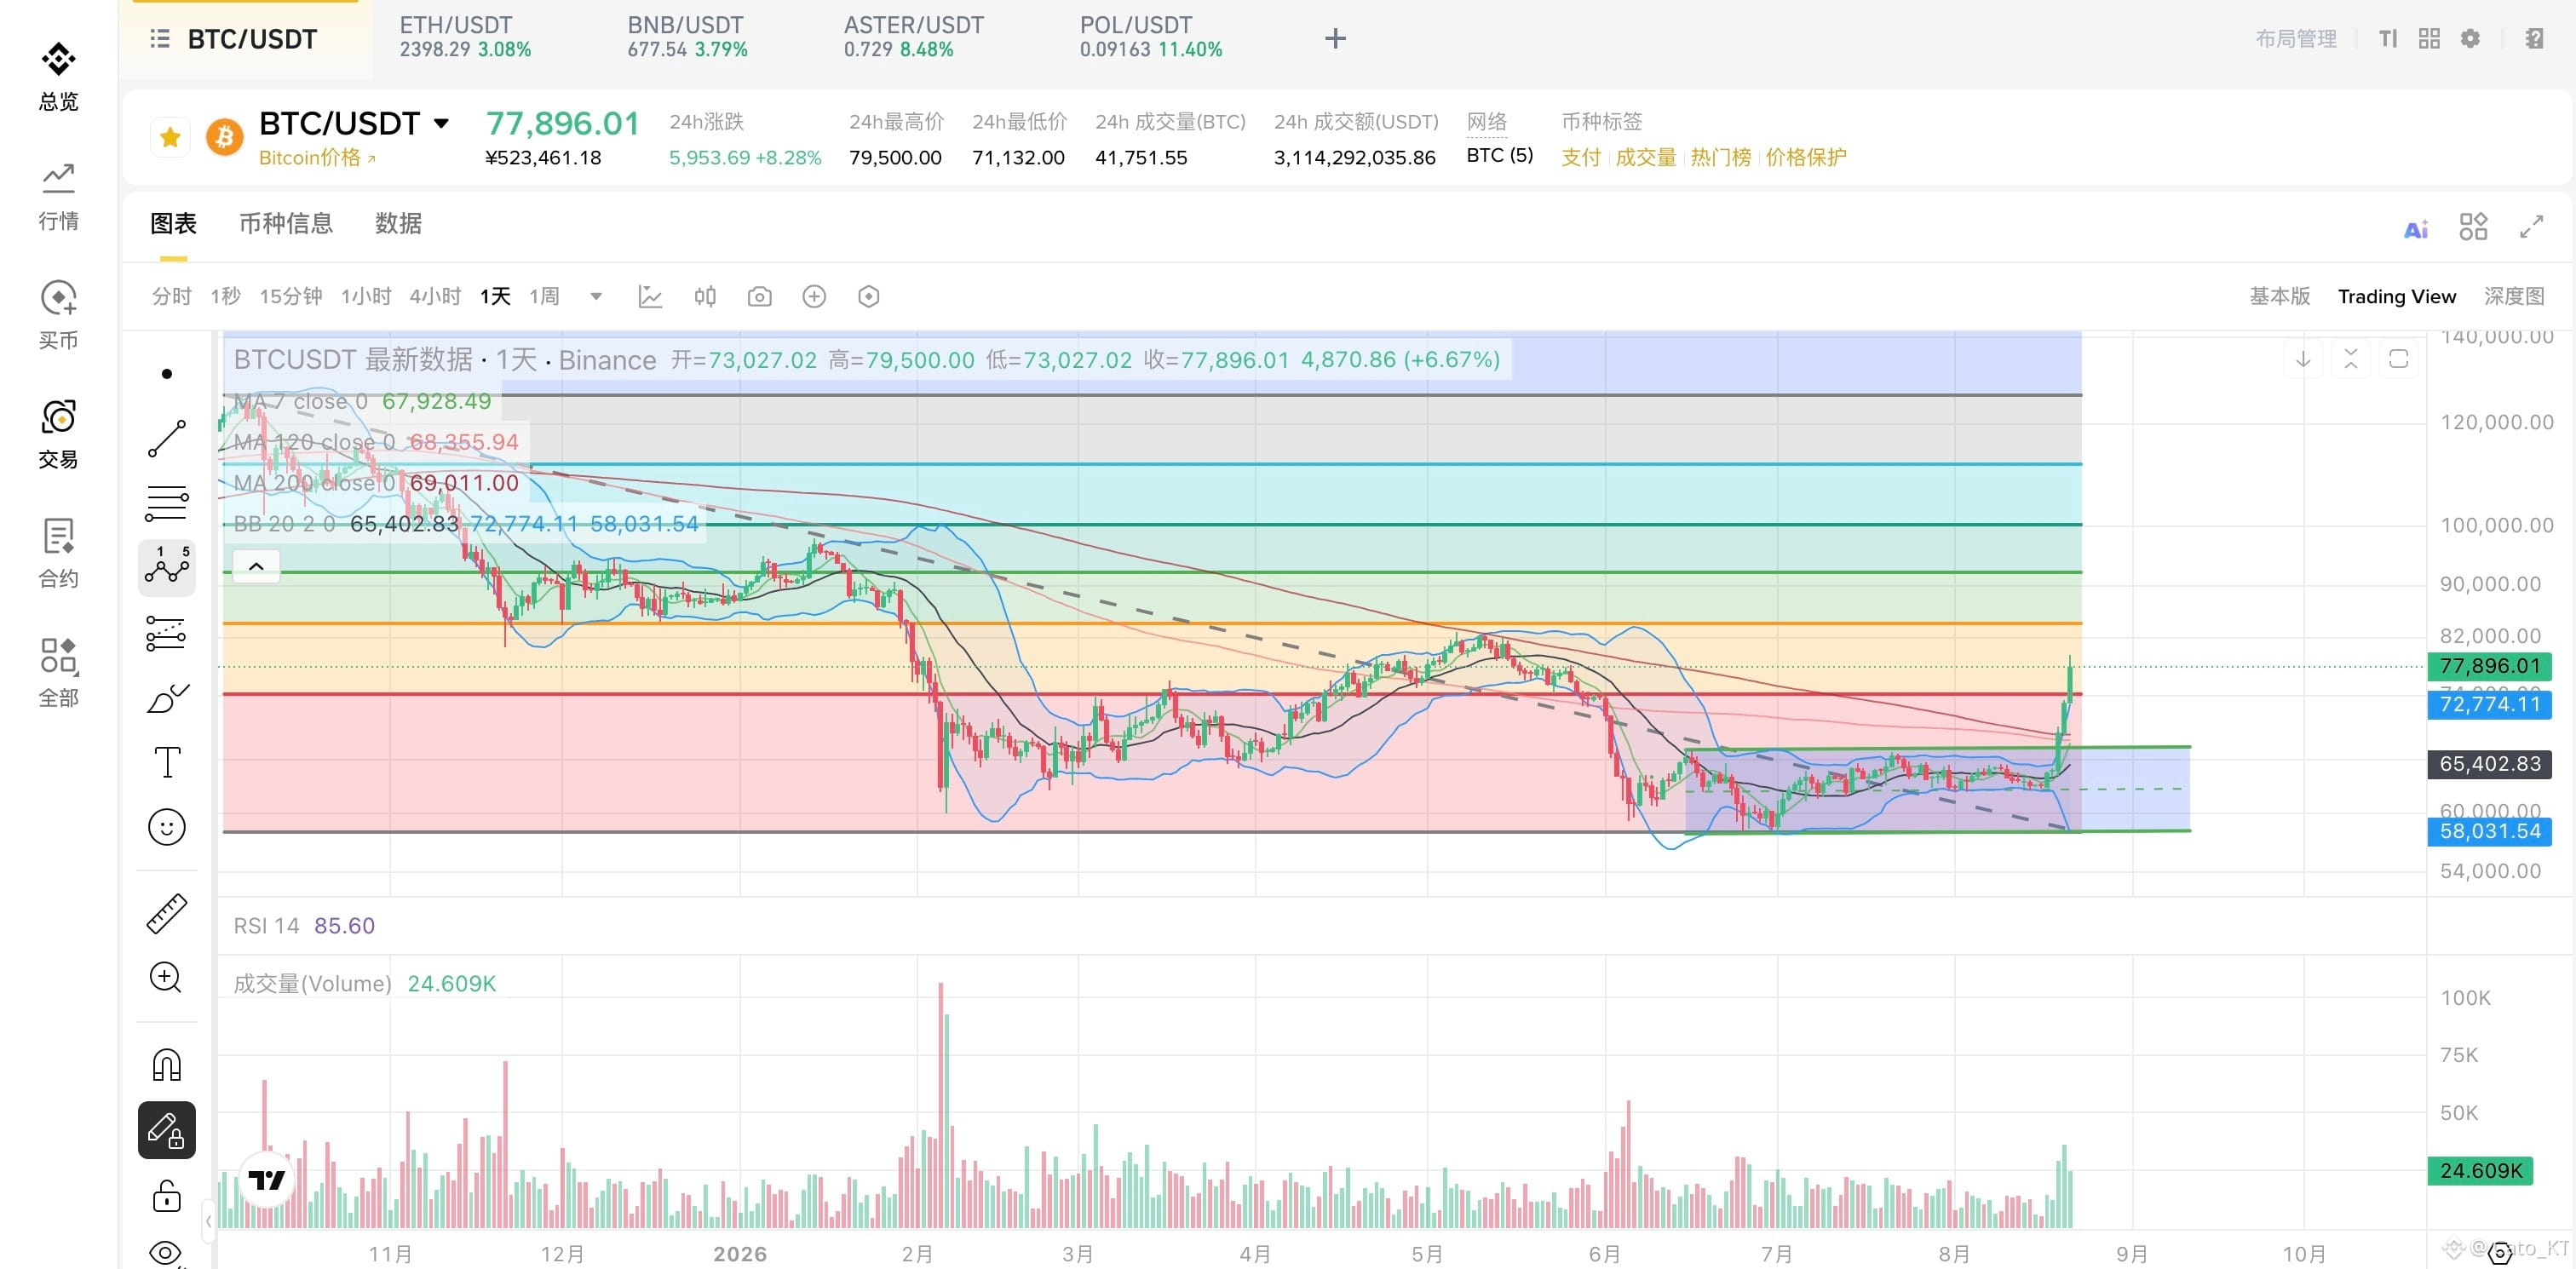
Since the data has temporarily confirmed #Bitcoin’s price rise, where should we look back at the chart? After the price broke above 74,200, it has remained momentum-filled.
Continuing yesterday’s net inflows from the ETF and funds once again broke the highest level in three months—so the upside imagination space needs to keep opening.
74,200 is the first resistance of the Fibonacci rebound from the bottom range. The move up to this point is a weak rebound; around 84,000 is where a typical rebound is completed, and around 92,000 is where a strong rebound happens.
Following this logic, combined with the current data being sufficiently dynamic, the next key point is how price behaves around 84,000. In particular, focus on whether this rebound can break through the daily previous high near 82,600 along the way. Whether it can make a new high will indicate whether the subsequent logic plays out differently.
a. If the rebound breaks to a new high and reaches 84,000 to complete a normal rebound, BTC has effectively finished bottoming and moved out of the weak zone. The probability of a further drop later to again test the 58,000—60,000 range is relatively small. Also, the bottoming in the bottom range has likely already been completed. After the next pullback, that’s when the opportunity for a new trend to begin arrives.
b. If the rebound fails to break to a new high and stalls in the 80,000—82,000 range, then you need to be alert to whether the next pullback will break to a new low. Referencing the previous round of daily chart action, you must be careful and verify whether a new low is actually broken and whether the bottom range has truly completed its confirmation. Whether a new trend starts afterward depends on whether it can build a solid base effectively.
Honestly, from a macro perspective—and from the risk-market perspective represented by the U.S. stock market—this rally in the past few days associated with $BTC has indeed been quite exaggerated. Of course, price increases aside, you know: a certain “political show” at the White House Crypto meeting that I interpreted as such has been spun into various industry-friendly headlines.
Of course, returning to my thinking over these past few days, it’s not that I’m overly bearish. I’m cautiously optimistic. For the rise, I actually would prefer to see it, because most of my positions and the contract costs are around 90,000. But facing this kind of move, I don’t think I should just blurt out a “bull market” call directly—I still think we need to be careful.
The only downside is that around 60,000 I didn’t dare add to my BTC position. At the time I calculated that if I added at 60,000, I would have doubled—now it’s already back to breakeven. Too bad!
Continuing yesterday’s net inflows from the ETF and funds once again broke the highest level in three months—so the upside imagination space needs to keep opening.
74,200 is the first resistance of the Fibonacci rebound from the bottom range. The move up to this point is a weak rebound; around 84,000 is where a typical rebound is completed, and around 92,000 is where a strong rebound happens.
Following this logic, combined with the current data being sufficiently dynamic, the next key point is how price behaves around 84,000. In particular, focus on whether this rebound can break through the daily previous high near 82,600 along the way. Whether it can make a new high will indicate whether the subsequent logic plays out differently.
a. If the rebound breaks to a new high and reaches 84,000 to complete a normal rebound, BTC has effectively finished bottoming and moved out of the weak zone. The probability of a further drop later to again test the 58,000—60,000 range is relatively small. Also, the bottoming in the bottom range has likely already been completed. After the next pullback, that’s when the opportunity for a new trend to begin arrives.
b. If the rebound fails to break to a new high and stalls in the 80,000—82,000 range, then you need to be alert to whether the next pullback will break to a new low. Referencing the previous round of daily chart action, you must be careful and verify whether a new low is actually broken and whether the bottom range has truly completed its confirmation. Whether a new trend starts afterward depends on whether it can build a solid base effectively.
Honestly, from a macro perspective—and from the risk-market perspective represented by the U.S. stock market—this rally in the past few days associated with $BTC has indeed been quite exaggerated. Of course, price increases aside, you know: a certain “political show” at the White House Crypto meeting that I interpreted as such has been spun into various industry-friendly headlines.
Of course, returning to my thinking over these past few days, it’s not that I’m overly bearish. I’m cautiously optimistic. For the rise, I actually would prefer to see it, because most of my positions and the contract costs are around 90,000. But facing this kind of move, I don’t think I should just blurt out a “bull market” call directly—I still think we need to be careful.
The only downside is that around 60,000 I didn’t dare add to my BTC position. At the time I calculated that if I added at 60,000, I would have doubled—now it’s already back to breakeven. Too bad!