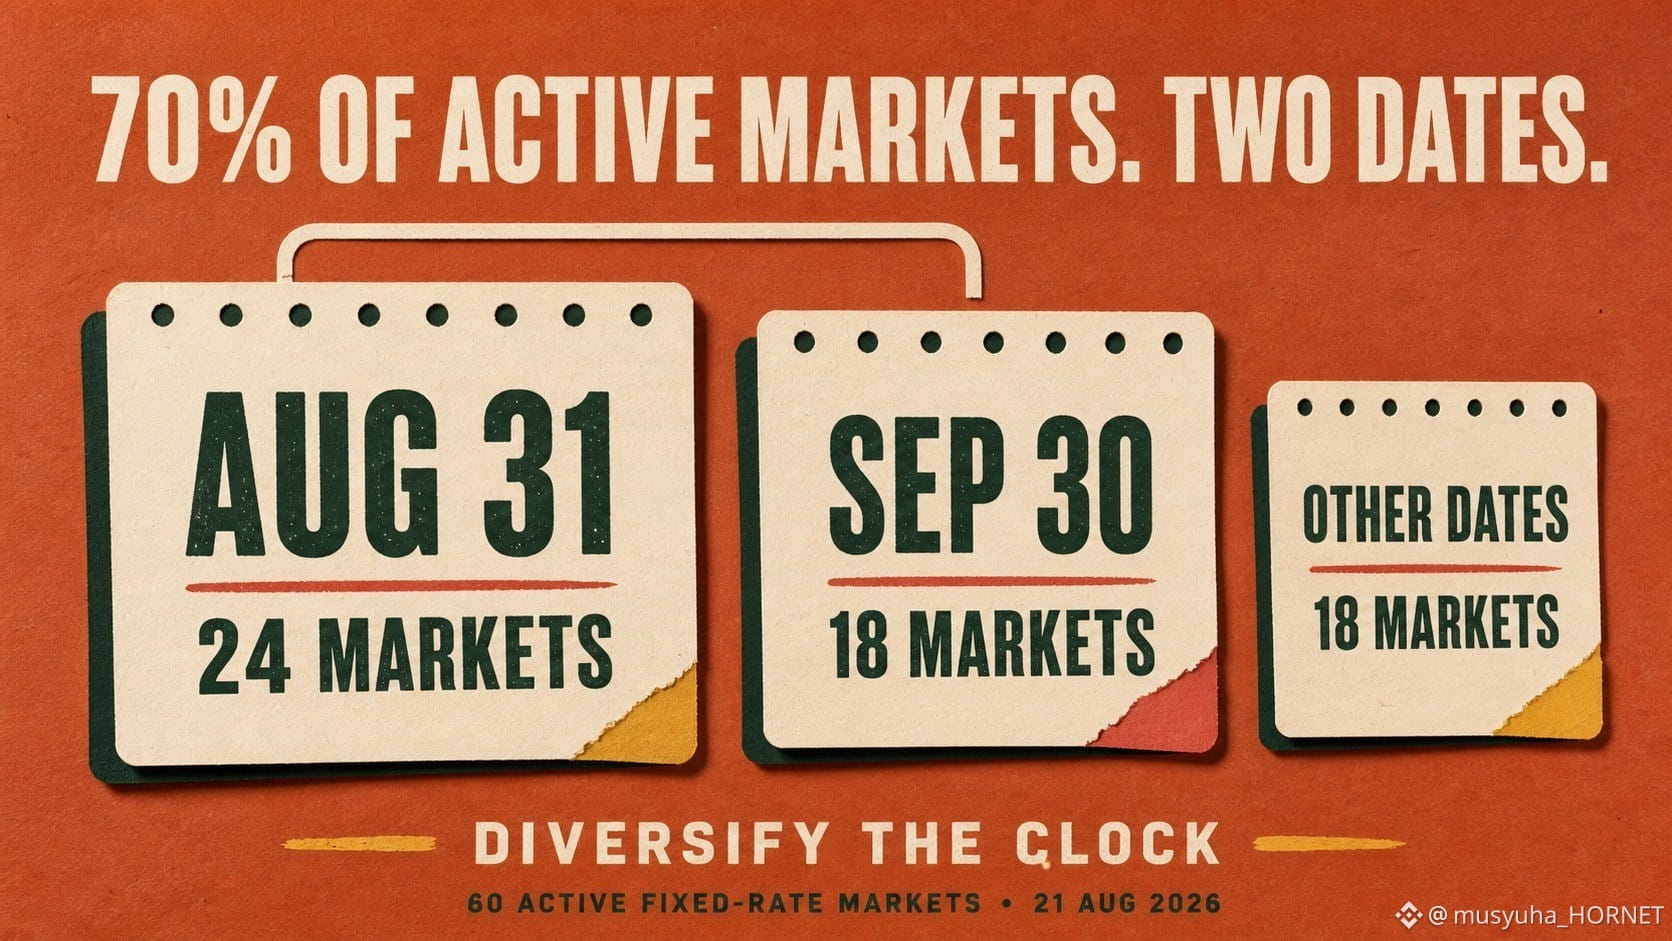
70% of TermMax’s active fixed-rate markets shared only two maturity dates.
I grouped every active non-Alpha fixed-rate market in TermMax’s public API by maturity instead of comparing APR rows one by one.
Snapshot: 21 August 2026, 07:48 UTC
• 31 August: 24 markets
• 30 September: 18 markets
• 30 August: 6 markets
• All other dates: 12 markets across 11 dates
So 42 of 60 markets—70%—mature on only two dates. Include 30 August and 80% sit on three.
But the capacity map told a different story.
The 42 markets maturing on 31 August and 30 September showed approximately $4.99 million in aggregate visible borrow capacity.
Just two markets maturing on 16 October showed approximately $6.69 million.
More markets did not mean more capacity.
This matters because maturity is the repayment deadline for borrowers and the redemption point for lenders. A portfolio can contain many separate markets while concentrating these events on the same dates.
This is not a prediction of market stress. It is a point-in-time measurement of calendar concentration.
My checklist:
1. Group exposure by maturity—not only by asset.
2. Compare market count with visible capacity.
3. Identify clustered repayment and redemption dates.
4. Recheck live quotes before execution.
My rule: diversify the clock, not only the collateral.
Public API snapshot; visible capacity can change and does not guarantee full-size execution at one rate.
Sources checked: TermMax public market API and official Market and Range Order documentation.
@TermMax #TermMax
I grouped every active non-Alpha fixed-rate market in TermMax’s public API by maturity instead of comparing APR rows one by one.
Snapshot: 21 August 2026, 07:48 UTC
• 31 August: 24 markets
• 30 September: 18 markets
• 30 August: 6 markets
• All other dates: 12 markets across 11 dates
So 42 of 60 markets—70%—mature on only two dates. Include 30 August and 80% sit on three.
But the capacity map told a different story.
The 42 markets maturing on 31 August and 30 September showed approximately $4.99 million in aggregate visible borrow capacity.
Just two markets maturing on 16 October showed approximately $6.69 million.
More markets did not mean more capacity.
This matters because maturity is the repayment deadline for borrowers and the redemption point for lenders. A portfolio can contain many separate markets while concentrating these events on the same dates.
This is not a prediction of market stress. It is a point-in-time measurement of calendar concentration.
My checklist:
1. Group exposure by maturity—not only by asset.
2. Compare market count with visible capacity.
3. Identify clustered repayment and redemption dates.
4. Recheck live quotes before execution.
My rule: diversify the clock, not only the collateral.
Public API snapshot; visible capacity can change and does not guarantee full-size execution at one rate.
Sources checked: TermMax public market API and official Market and Range Order documentation.
@TermMax #TermMax