

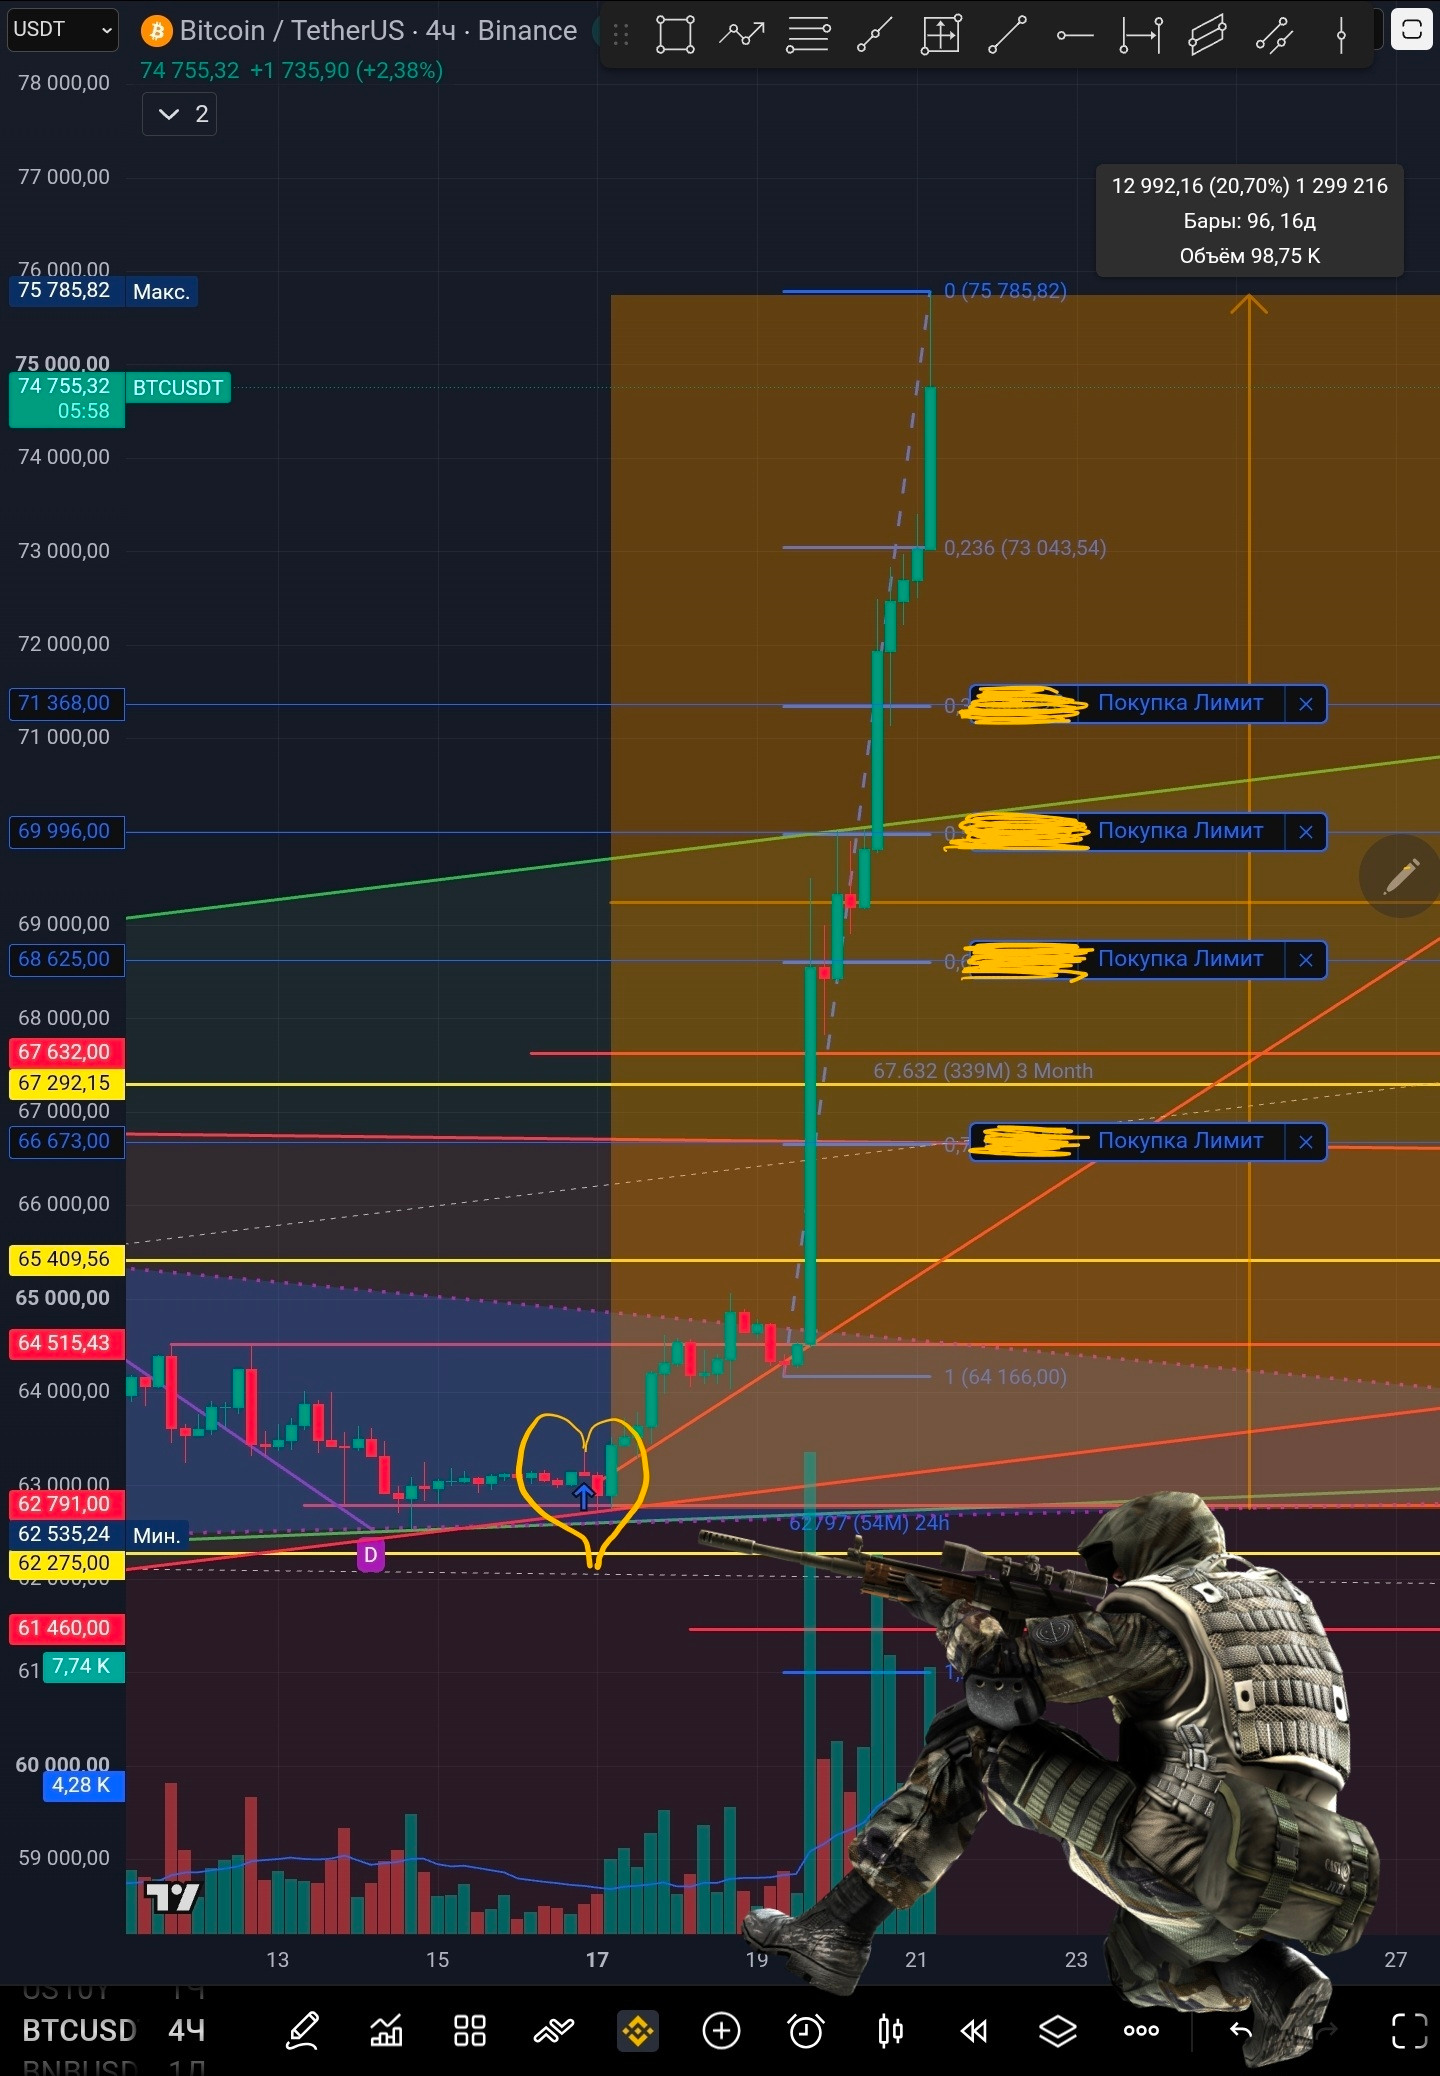
📍 Good morning, dear friends! Since the forecast, the price has moved up by 20%. Let’s look at the indicators and see what they tell us: Should we close positions? Or is there still time to wait?
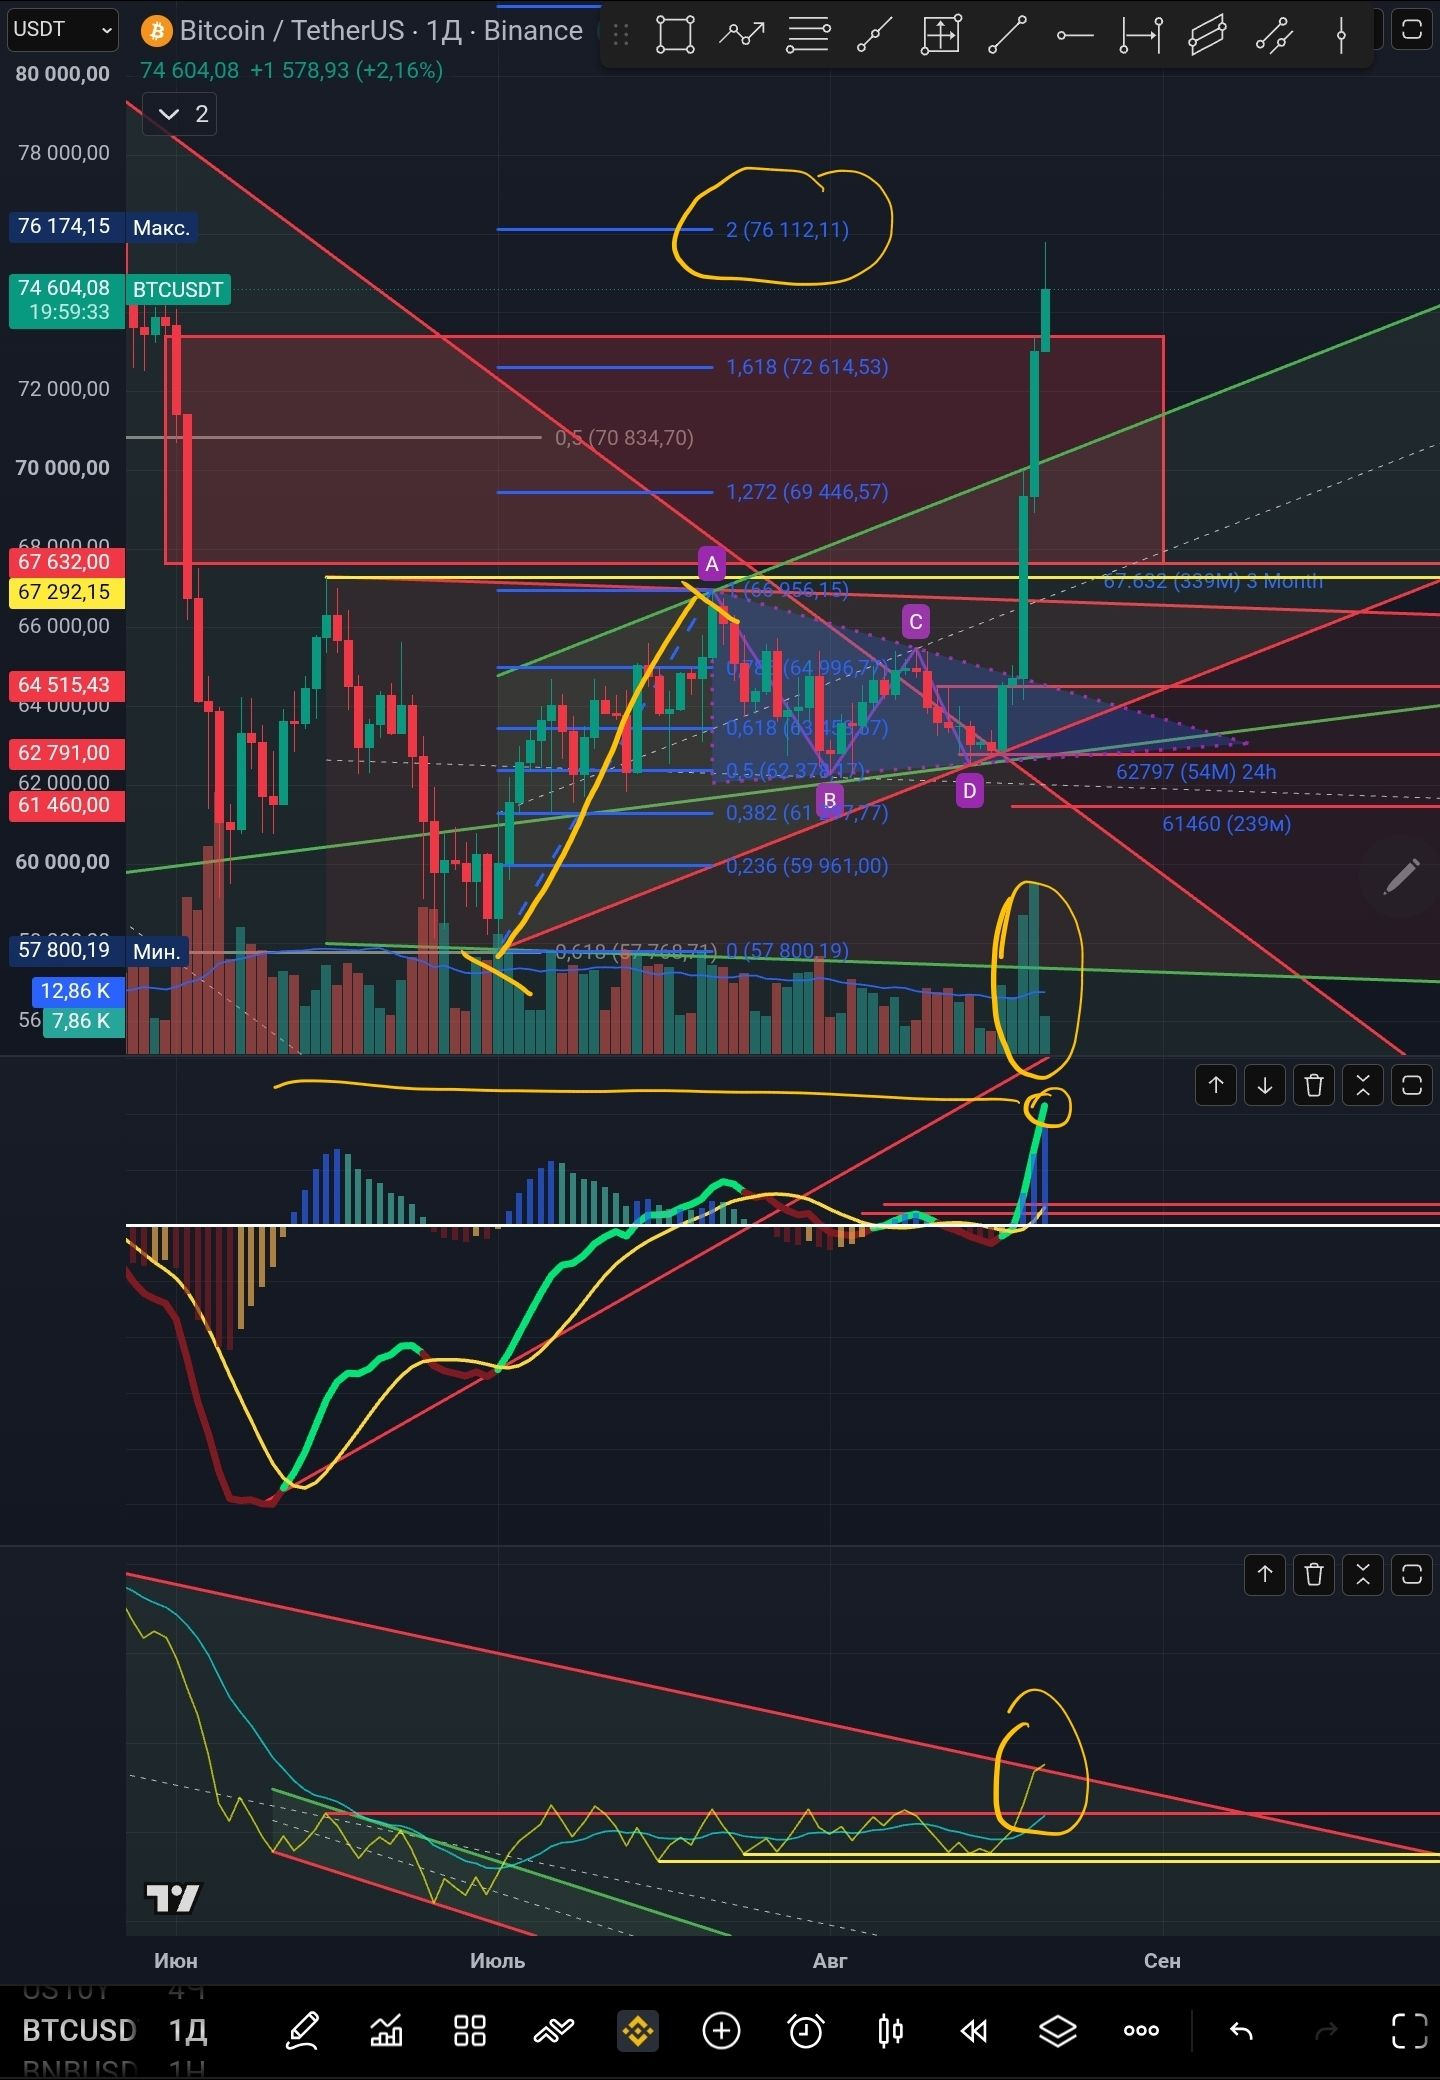
📍 On the daily candles. MACD has surged ahead beyond its previous highs—setting of the indicator is confidently positive. The balance volume indicator is trying to break through its long-term bearish downtrend channel that started on October 10, 2025. I hope it succeeds—that would give us another additional plus as we are turning around. Large volumes: the price has already covered twice the Fibonacci distance if we measure from the previous wave.
📝📝📝 Crypto brothers, now listen to the hint. The usual breaking of a wave relative to the previous wave:
0.6 — the next maximum is lower than the previous one; weak trend, or the start of a correction.
1.2 — the next maximum is higher than the previous one; the trend is present, but not certain. Most often it occurs on the fifth wave in Elliott, on the wave after which a correction begins.
Everything above 1.6, 2, 2.2, 2.6 — very strong trends. This most often happens on the third and most powerful Elliott wave.
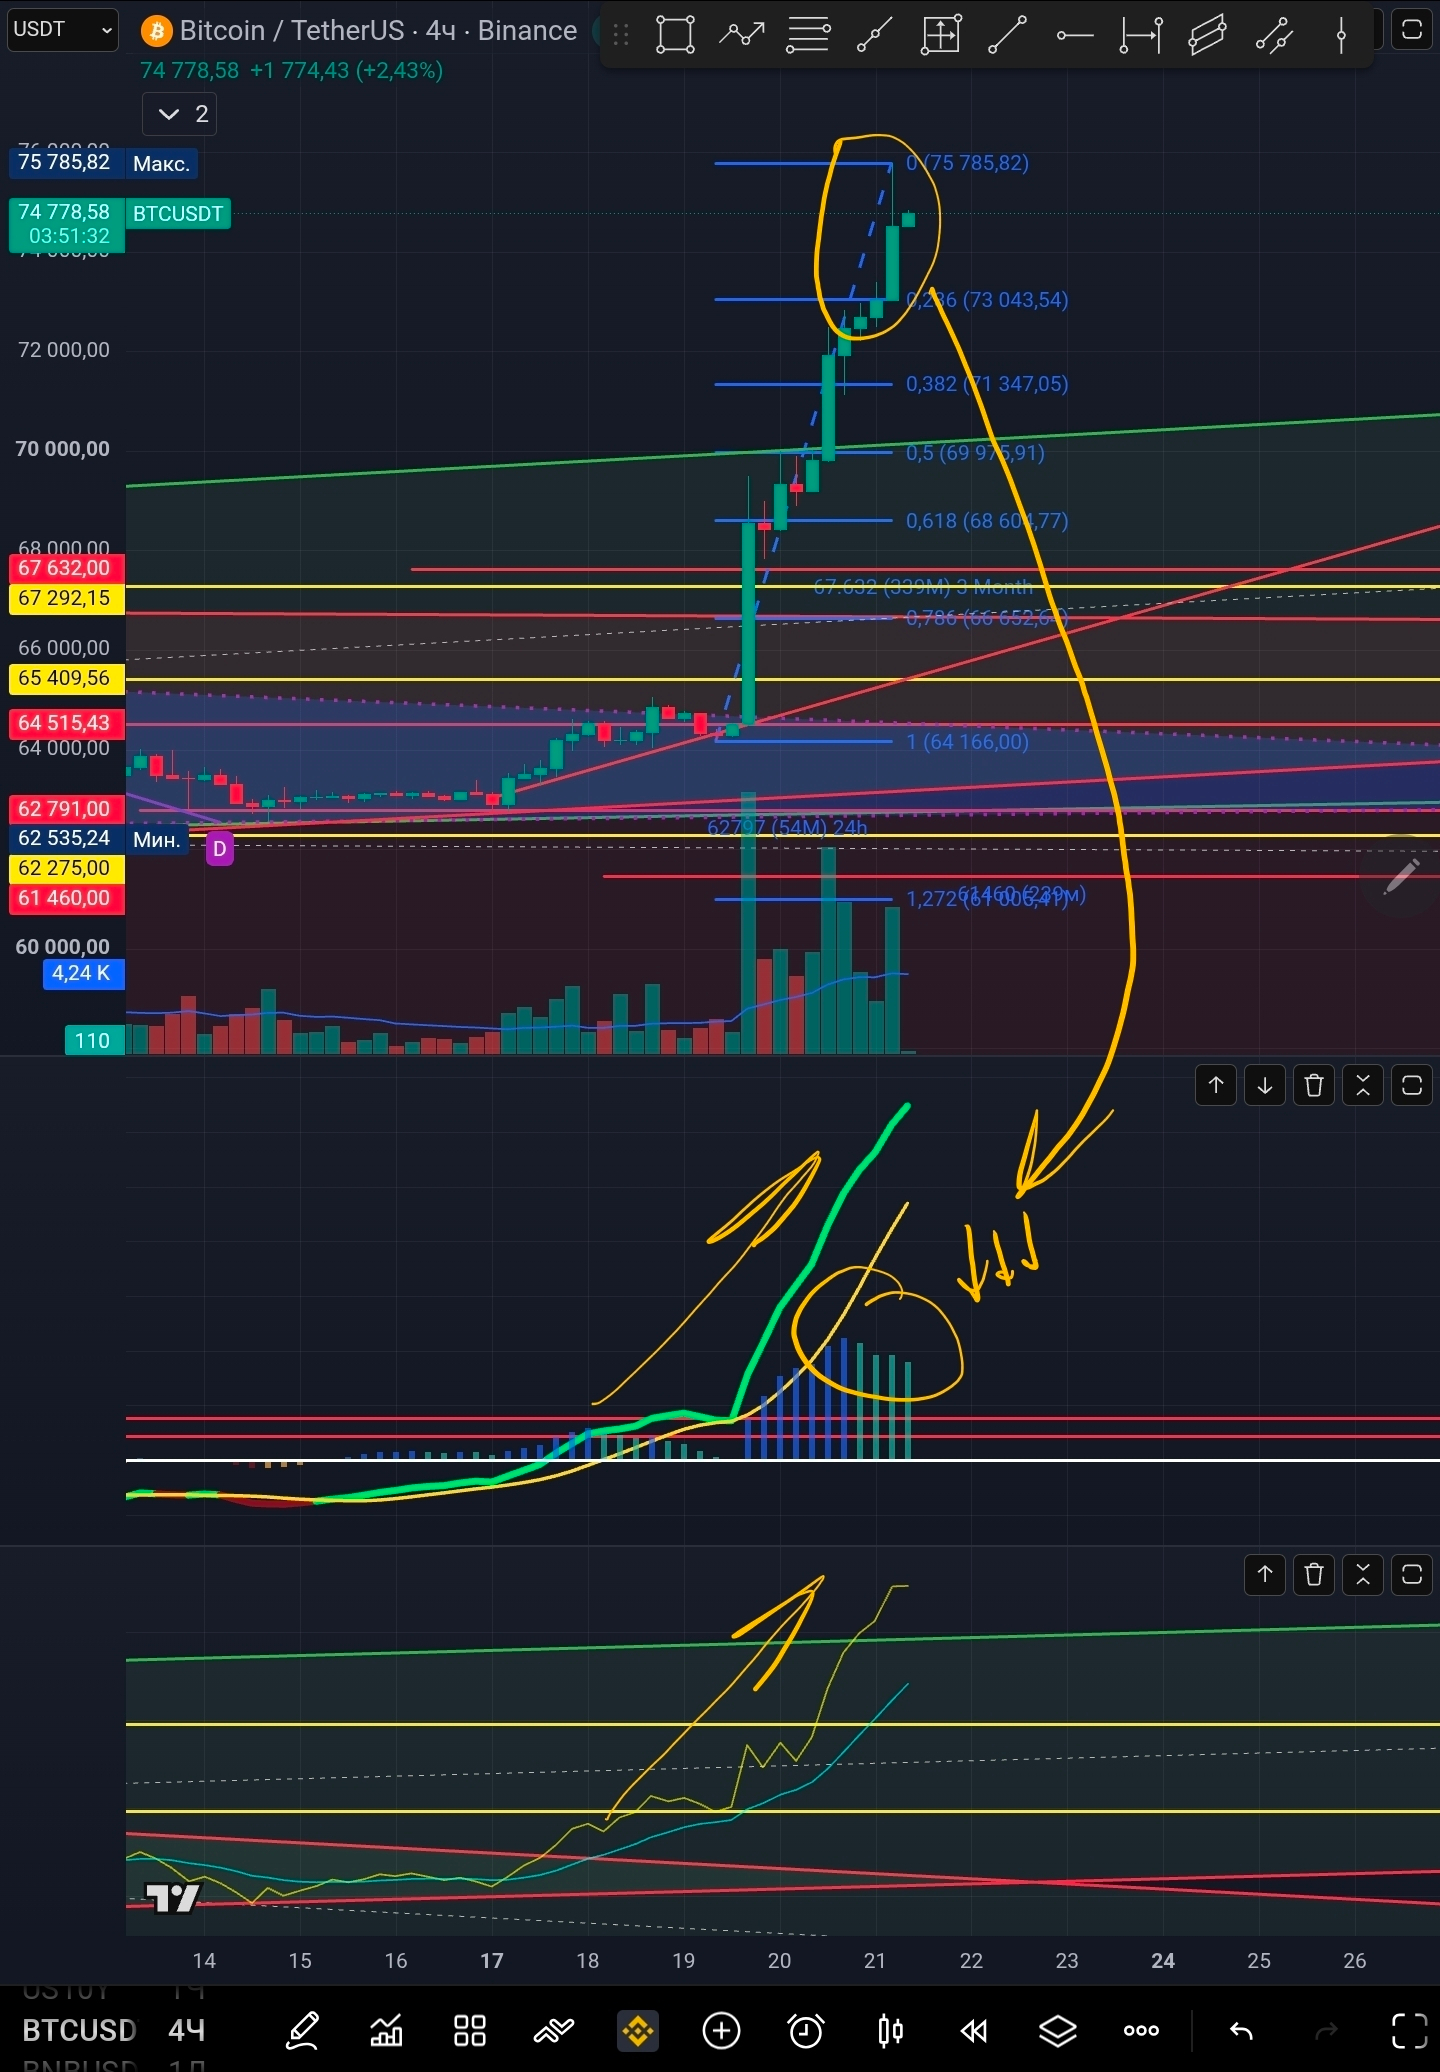
📍 On the four-hour candles. All indicators are pointing up; the signals are confidently positive. The balance of volume indicator has broken through the resistance of its rising channel. On the MACD indicator, there are the first signs of the price slowing down.
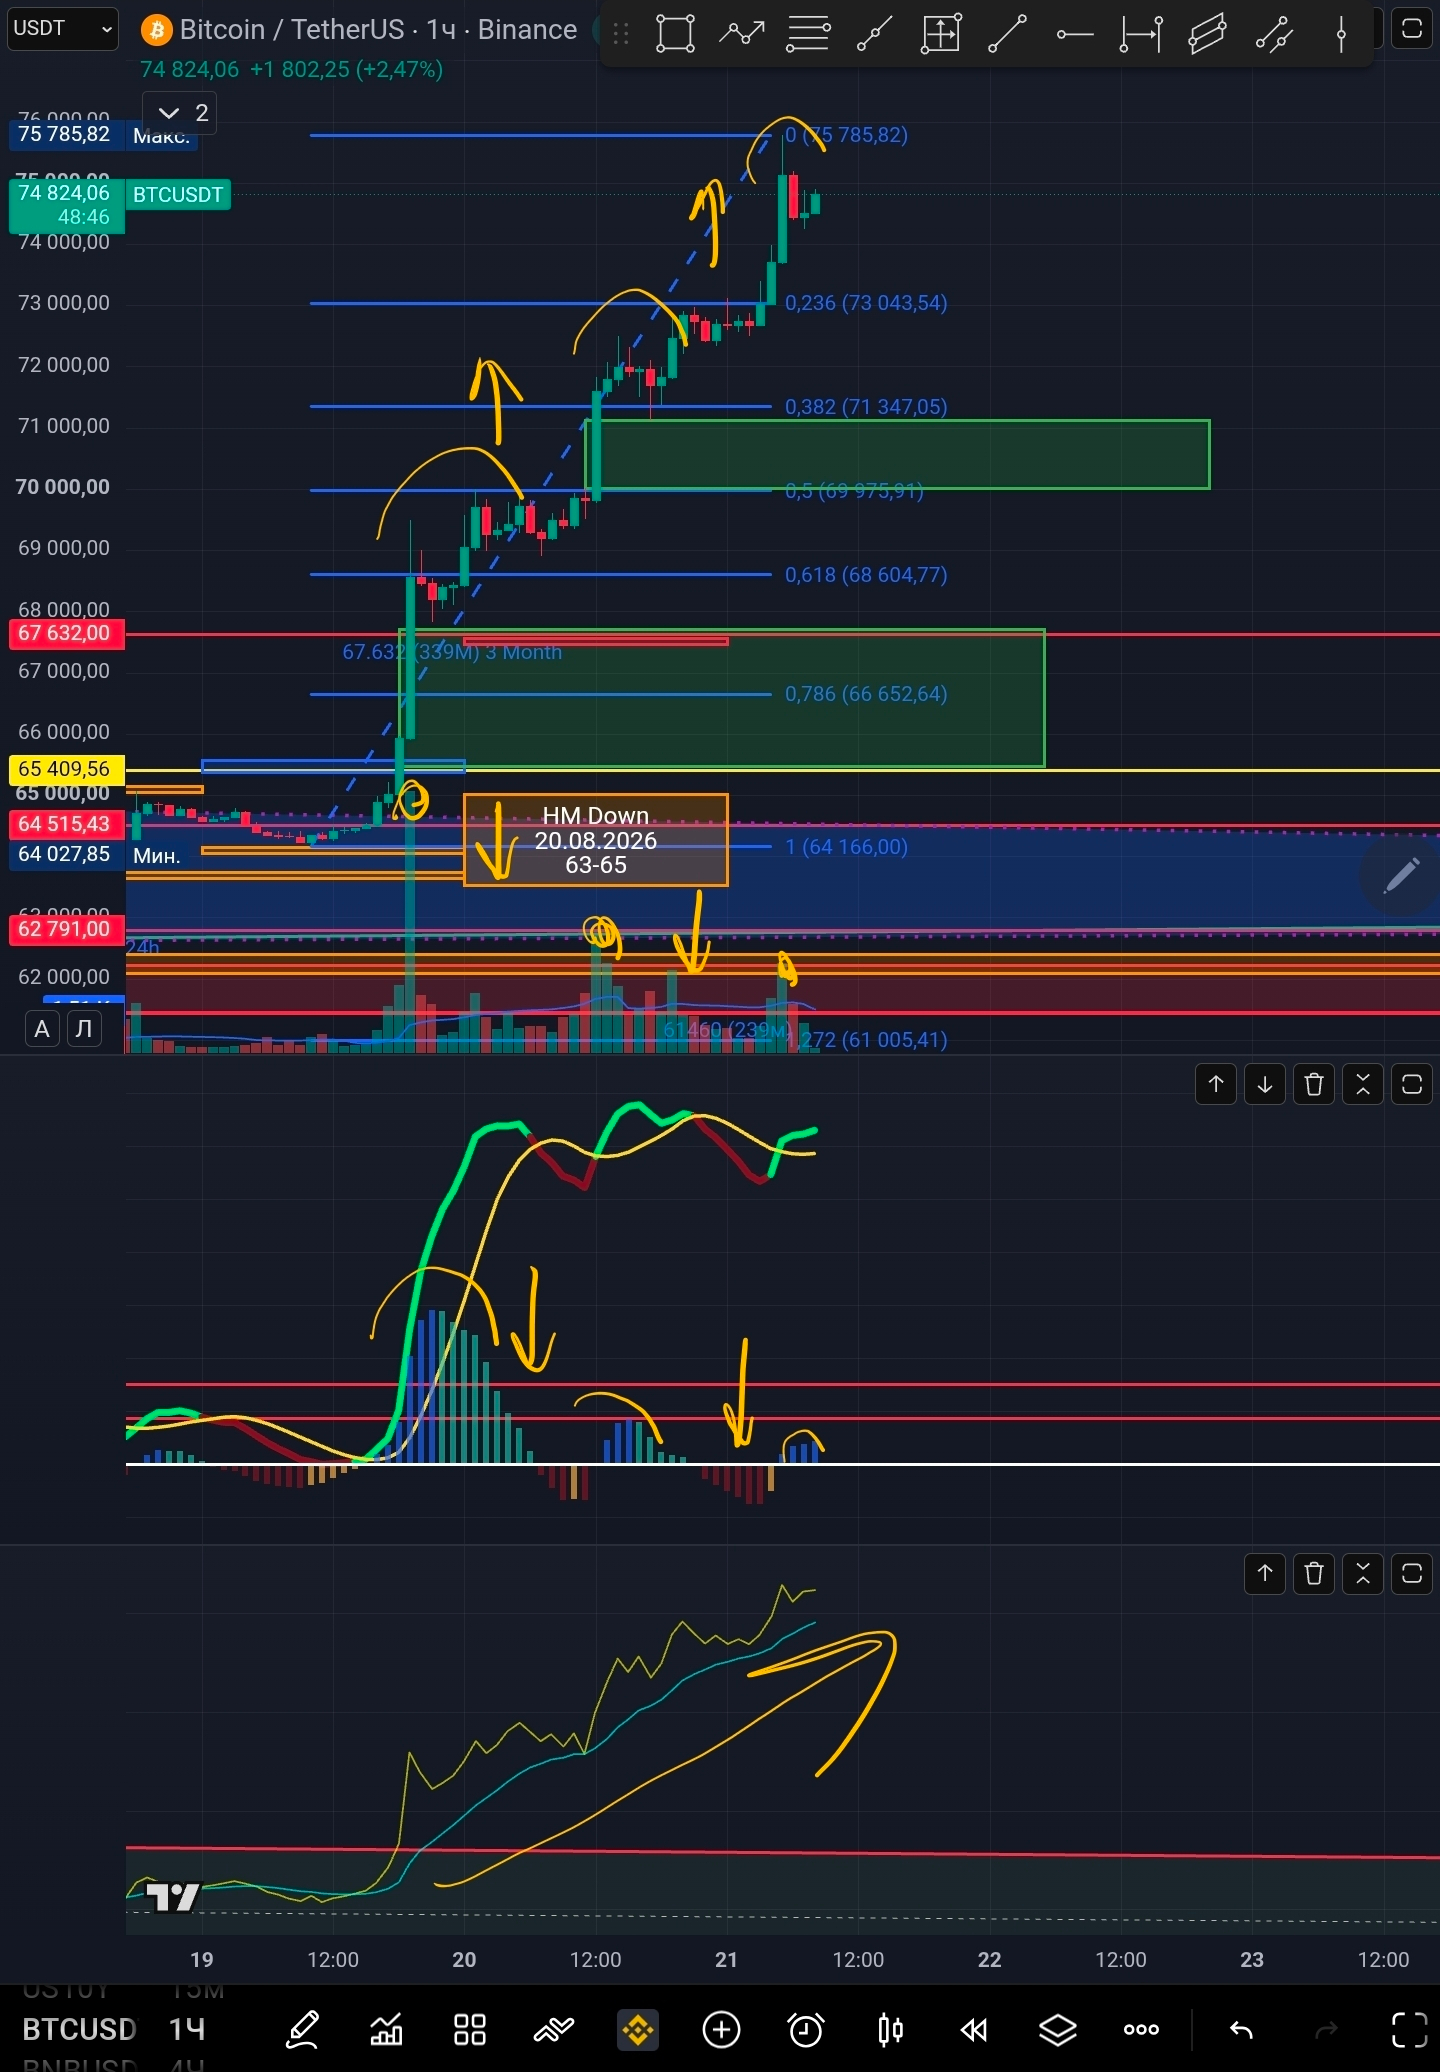
📍 On the hourly candles. There are the first signs of a bearish divergence on the MACD indicator and on the volume candles. The MACD oscillators are in a horizontal position. The price has two major imbalances. The overall outlook is moderately negative
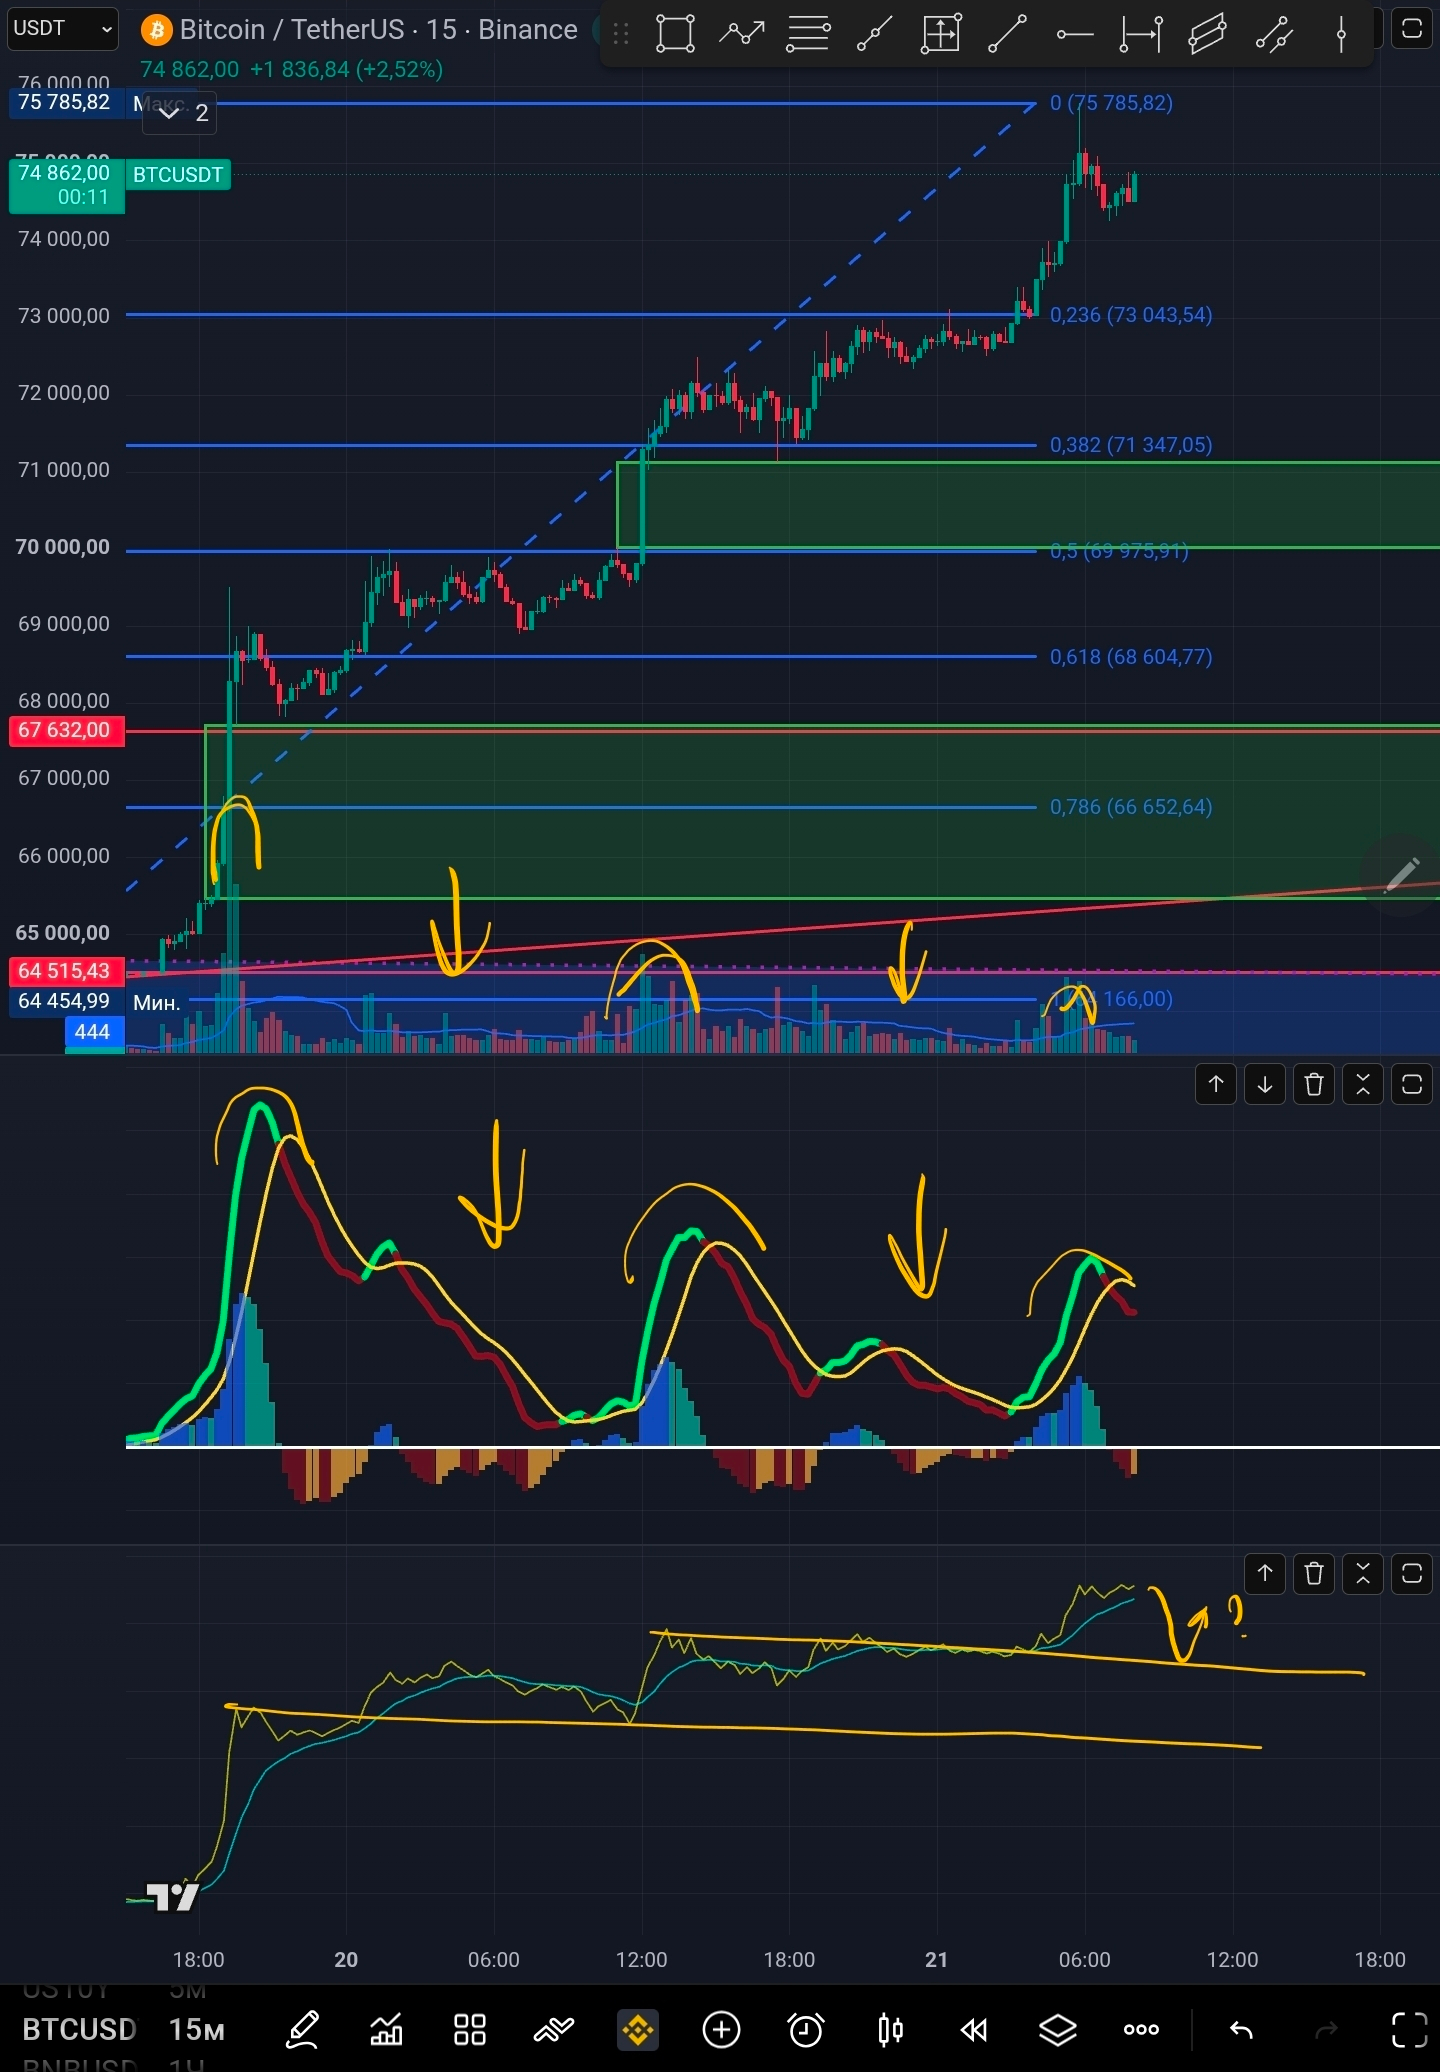
📍 On the 15-minute candles, there are the same bearish divergences as on the hourly candles, but they are more pronounced. In the balance of volume indicator, it’s visible how the moving average probed the previous high before the move up. The overall outlook is negative.
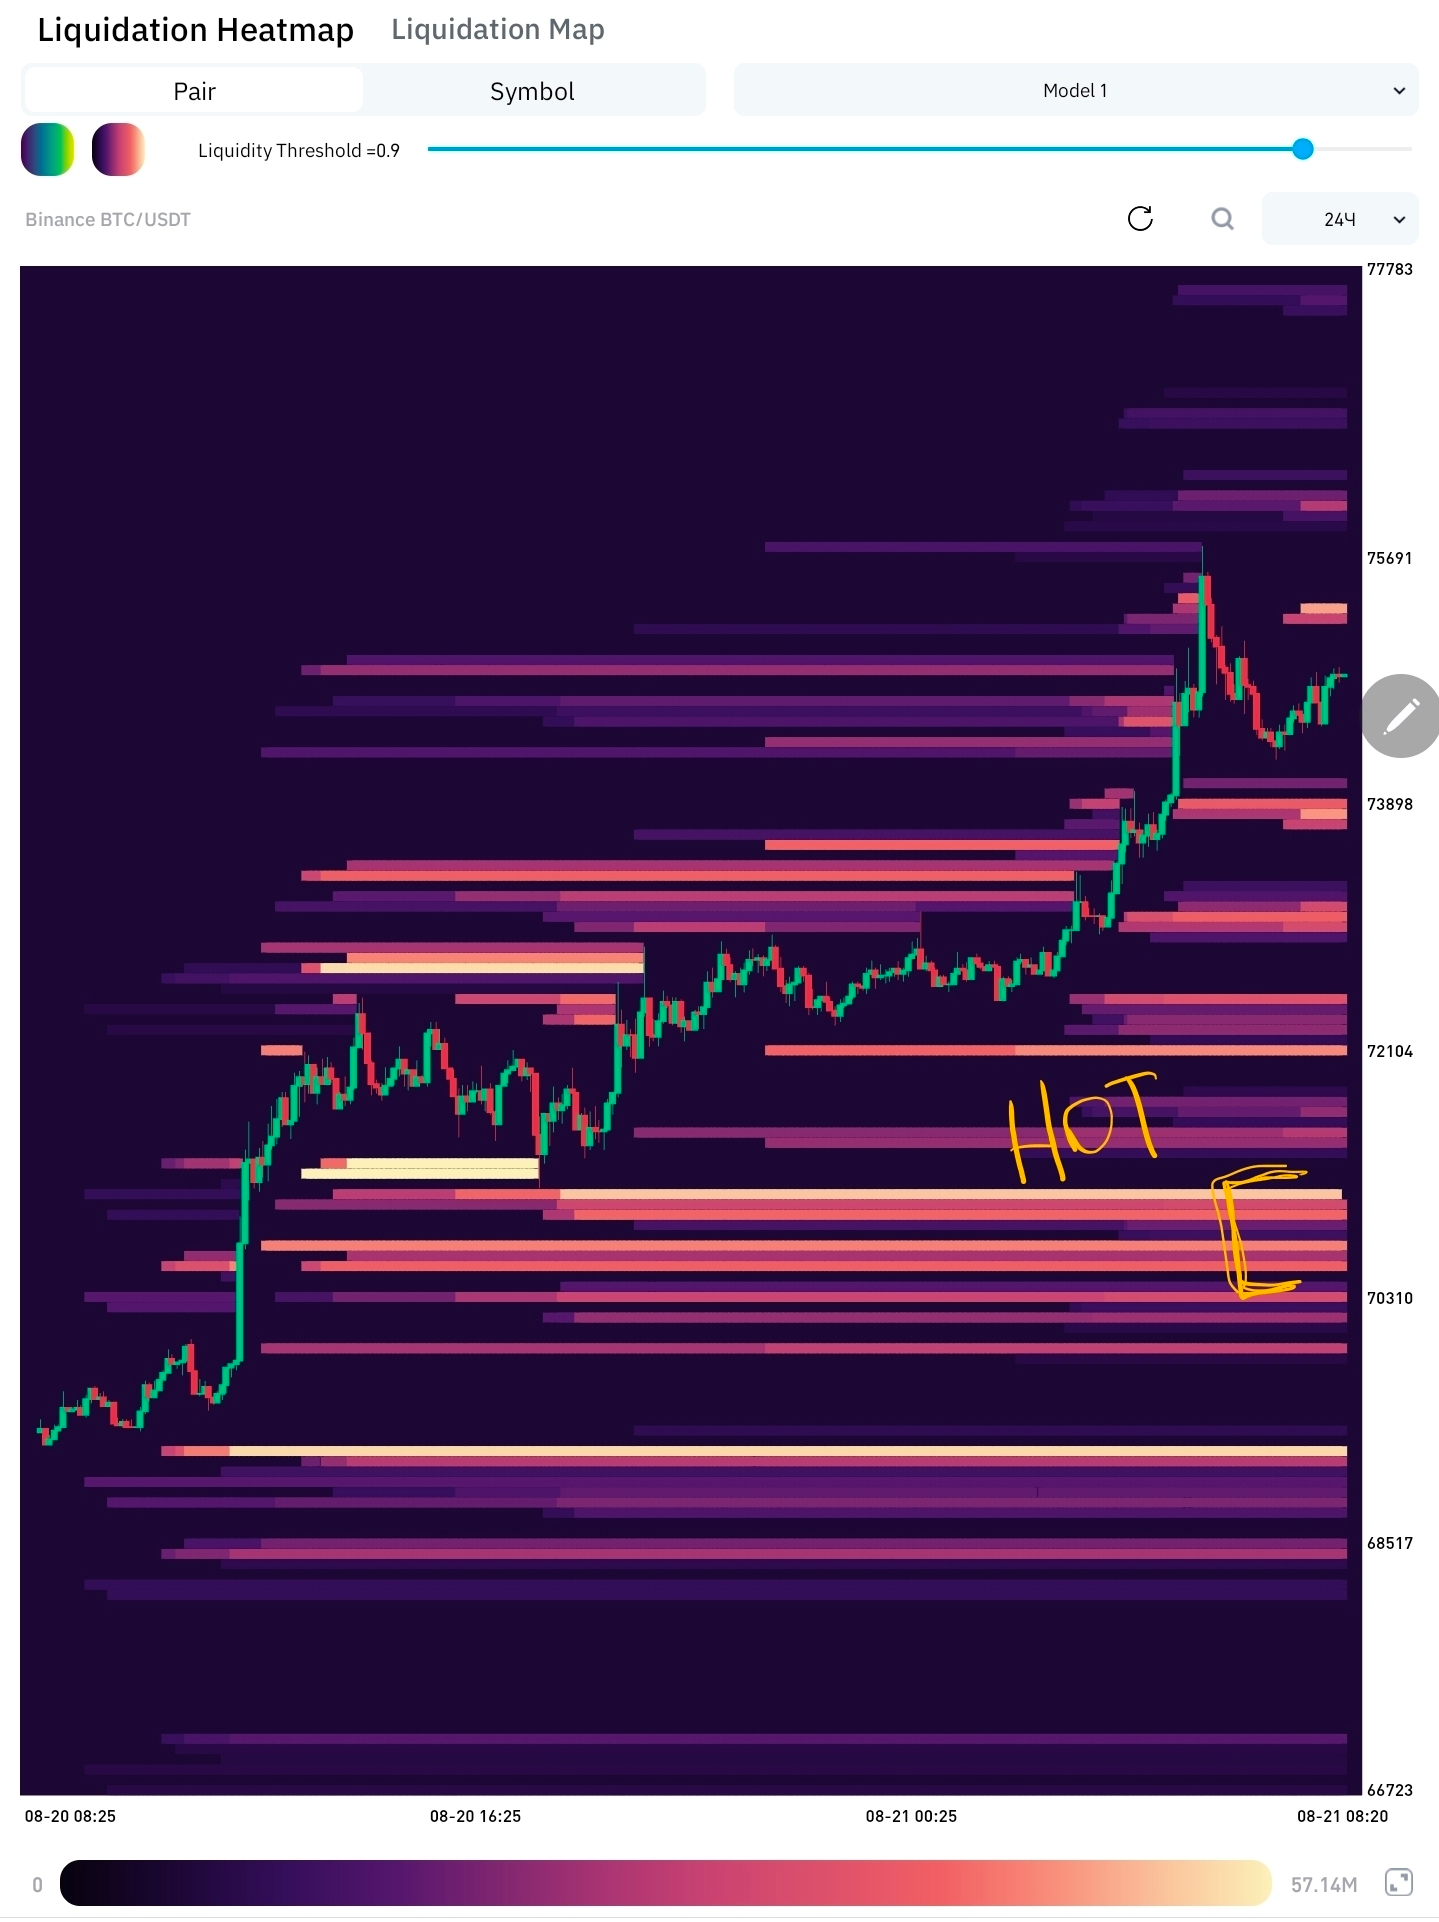
📍 The heatmap gives us a hot level of 70535-71058. All old relevant levels are also marked on the chart.
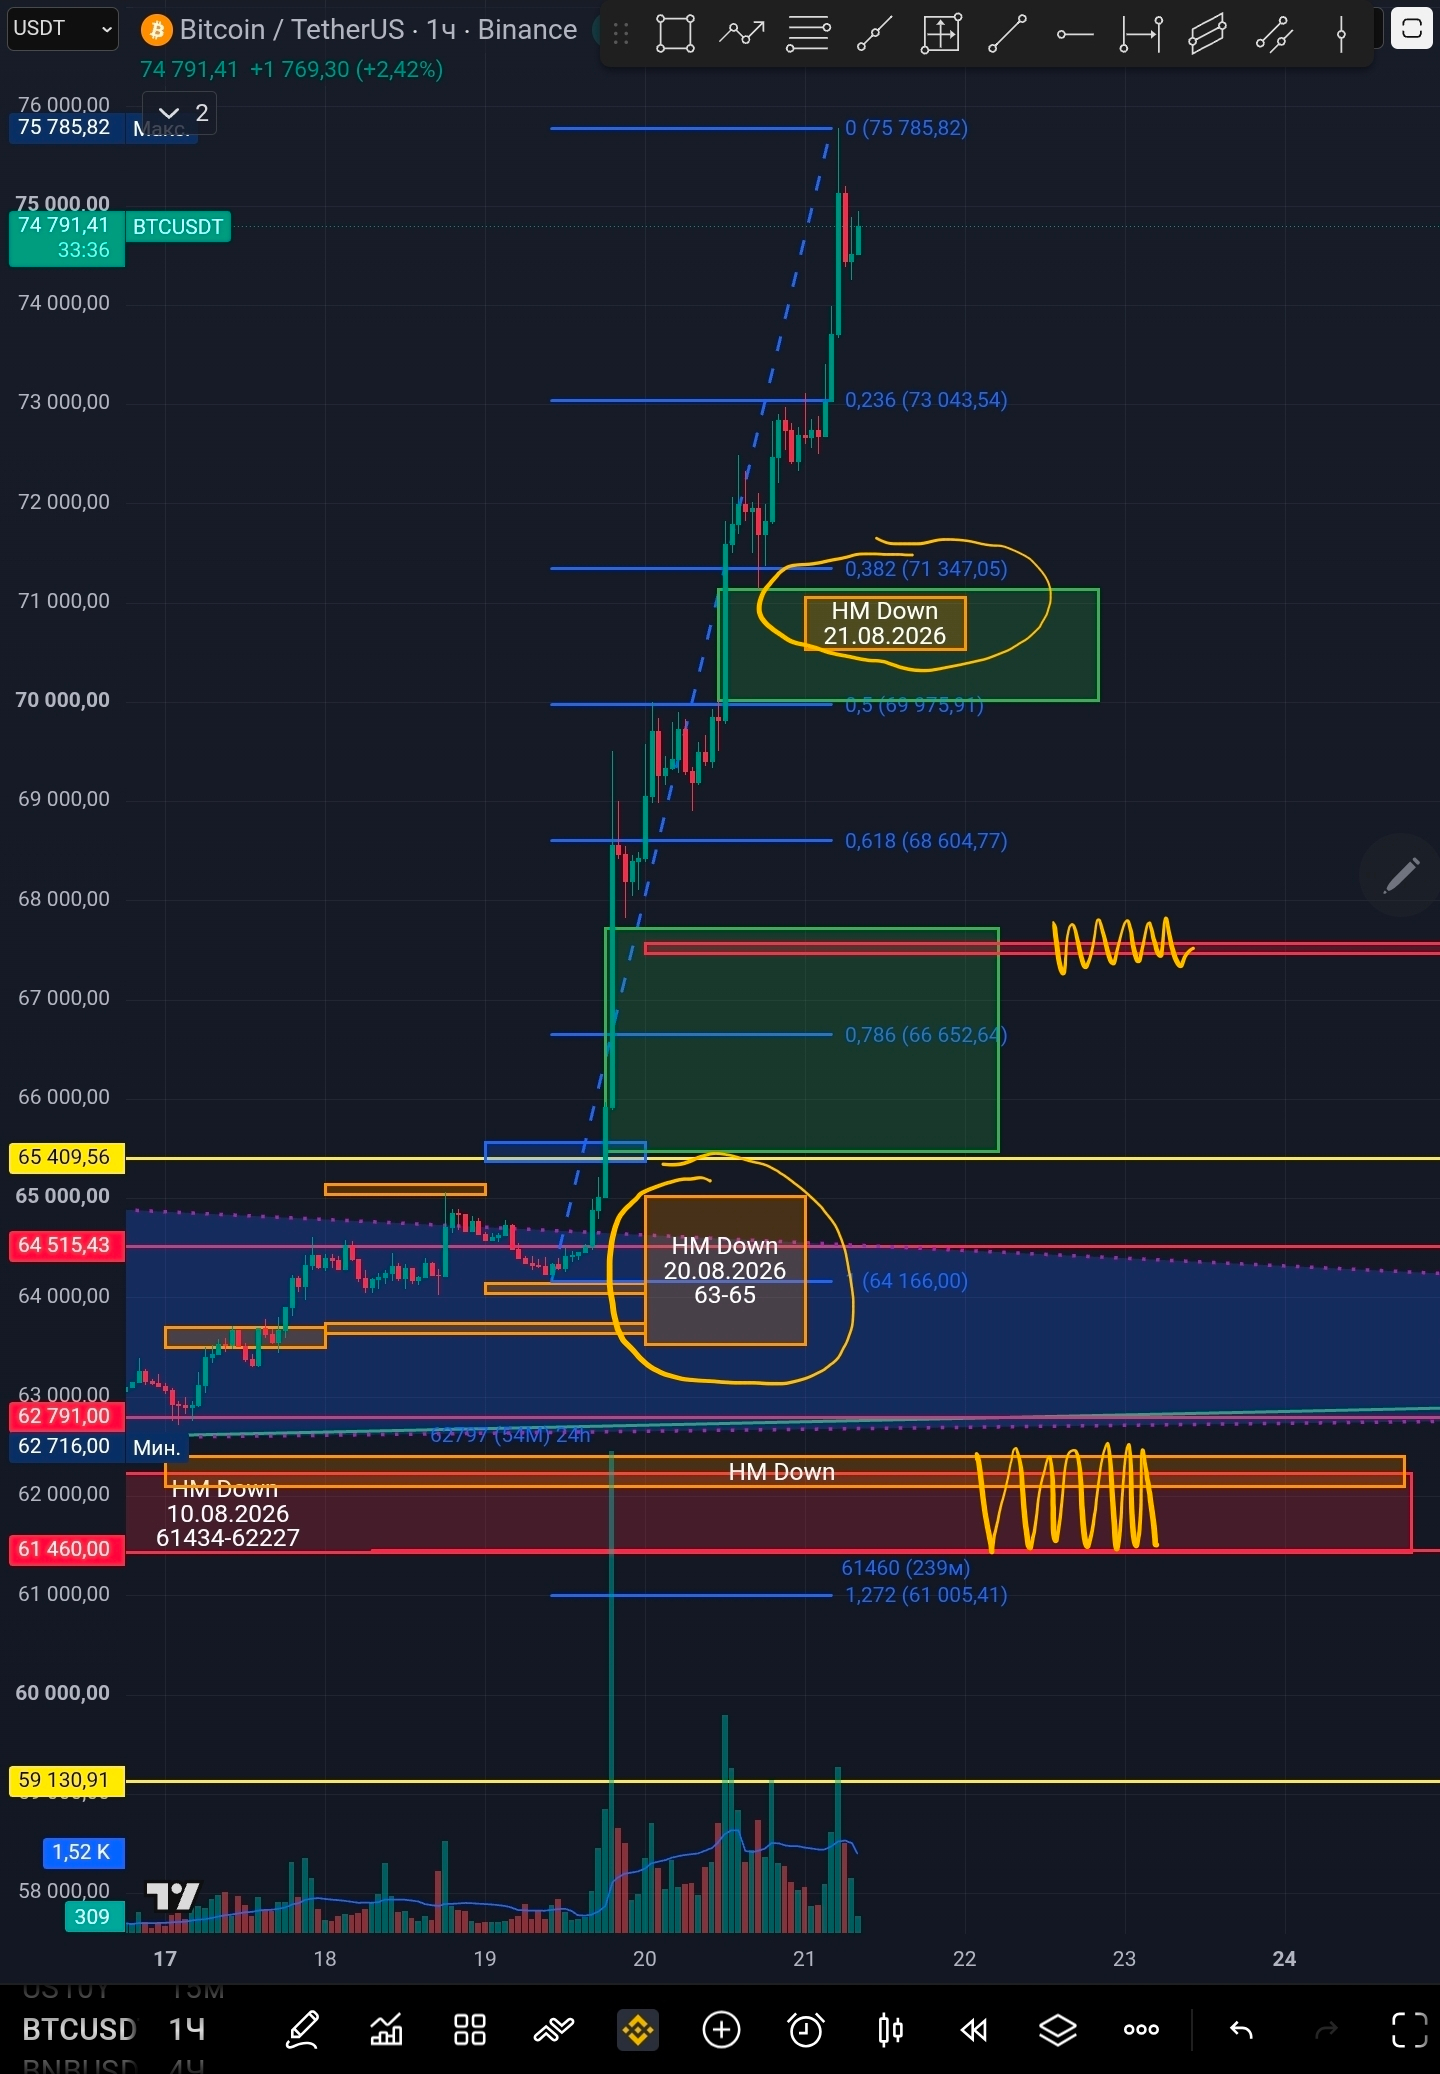
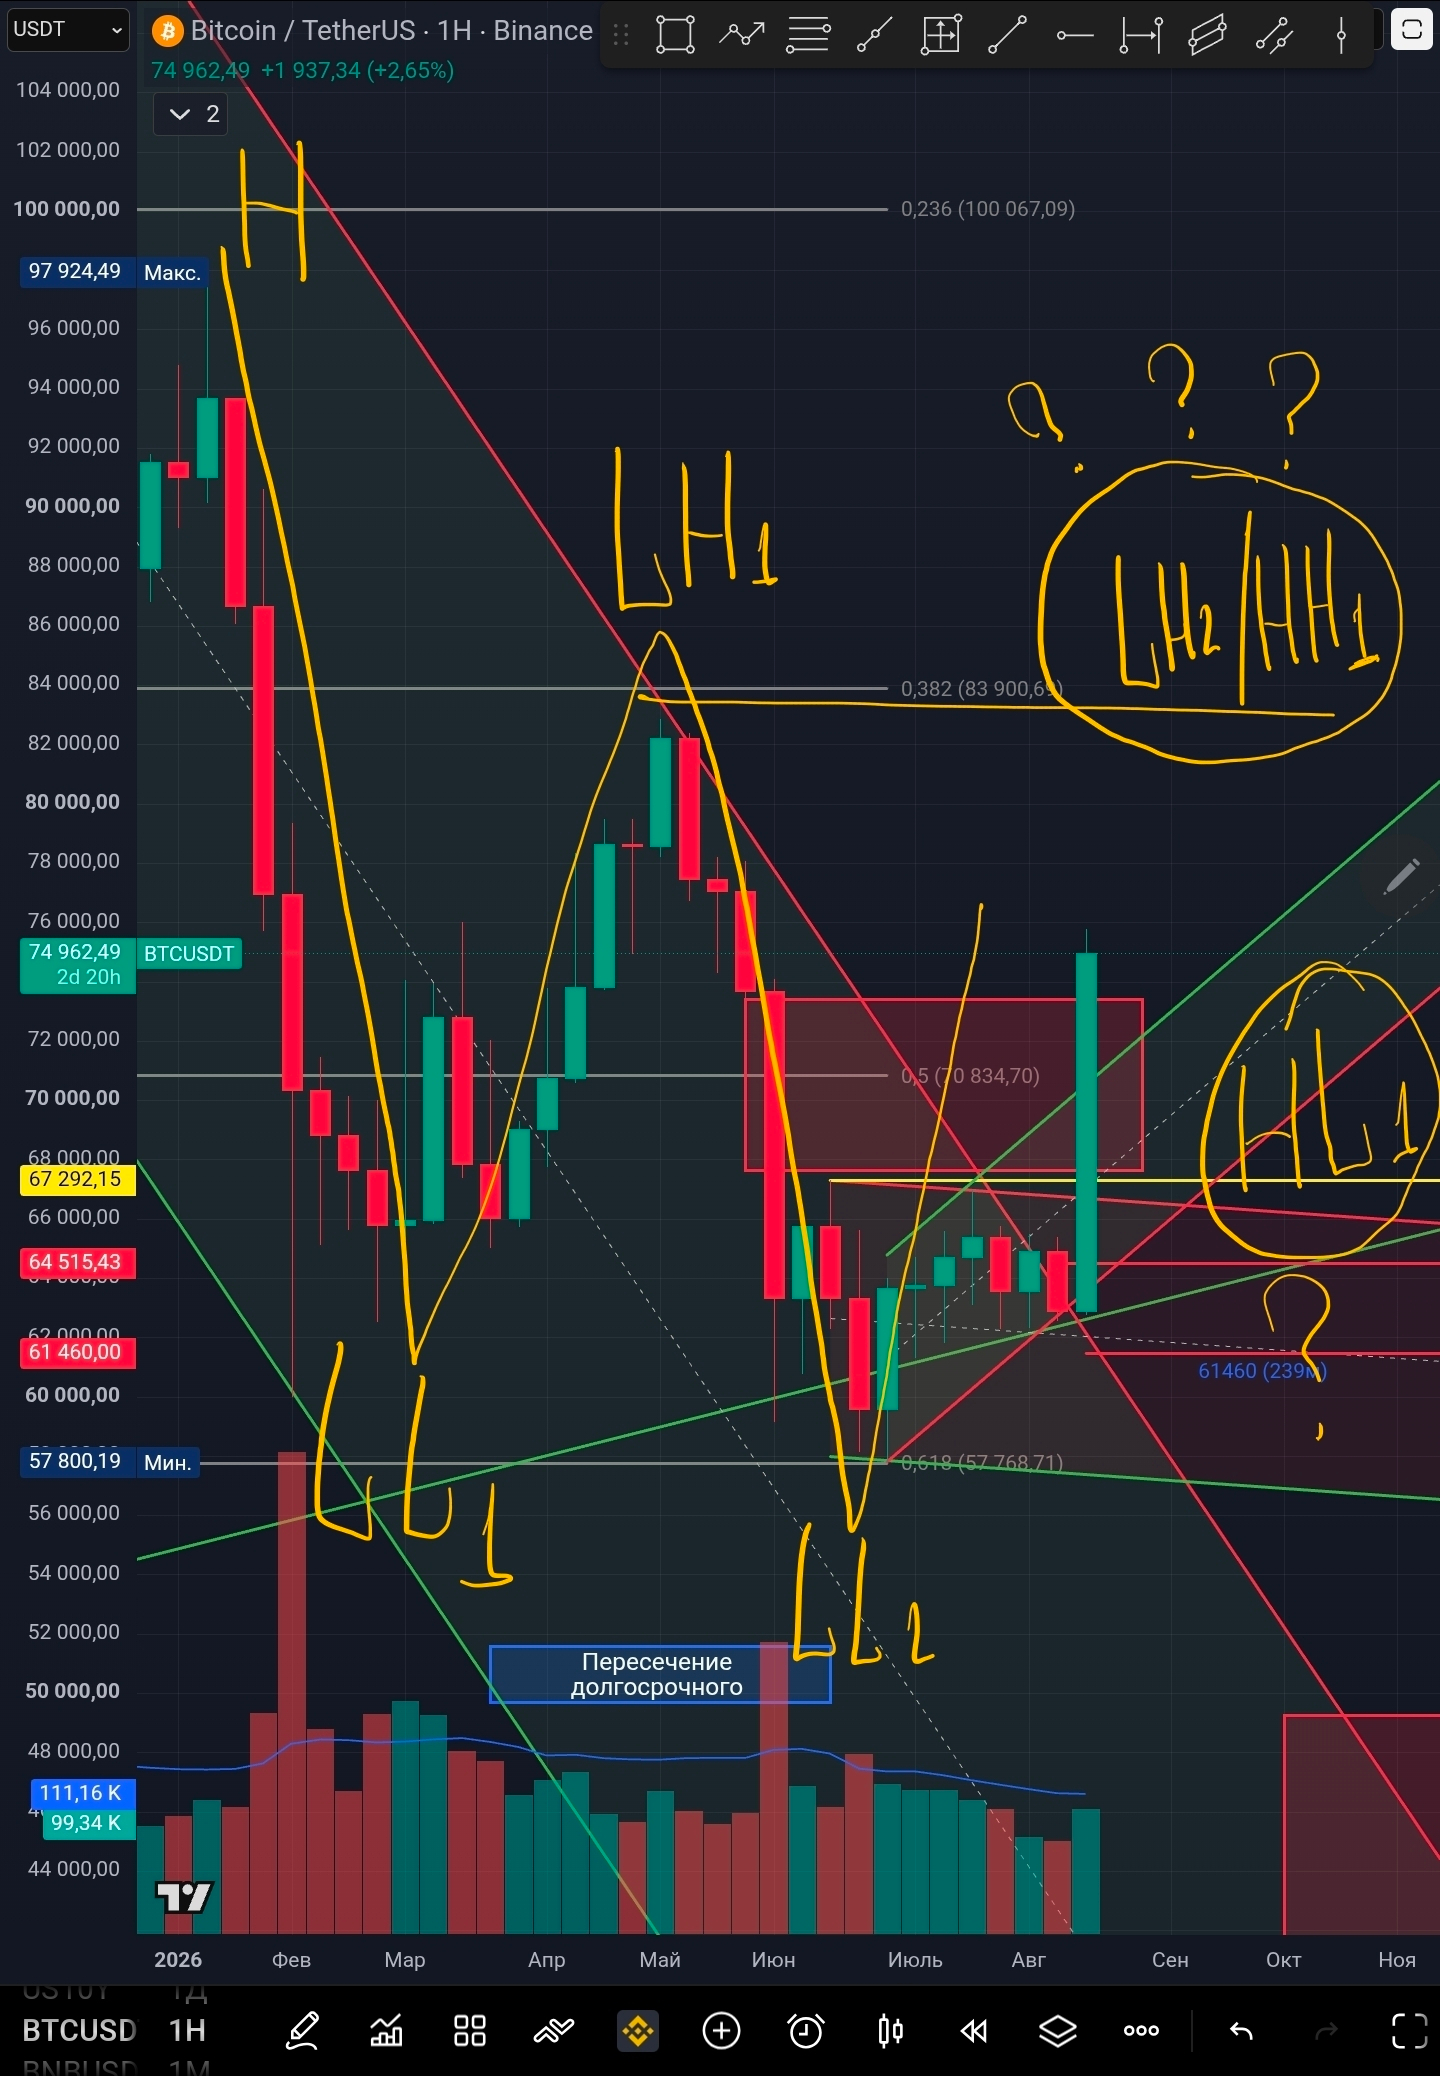
📍 Here’s my takeaway: as I said earlier, nothing has changed on the charts since June 22—it has only strengthened. I can also say the same about this day: since August 20, nothing has changed. The same upward movement continues, which sooner or later should stop. The same HH that the price must probe, and the same correction expected for this impulse. Every impulse has its own correction. Technical analysis says that after a strong move the correction is 0.3 by Fibonacci; any healthy correction falls within 0.3–0.6. A dangerous correction that can turn into a reversal is 0.7. Naturally, as it increases, the probability of correction during a trending move decreases from 0.3 to 0.7. I’ve again simply moved my limit orders, as you saw in the first picture at the beginning of the review. I’m not chasing the top, because buying at the peak is not profitable—almost nobody knows where the price will place its stop while price is still in the impulse phase. The first conclusions can only be made once the price has held for some time in a horizontal, ascending, or descending formation. Also worth noting: today is Friday. If a person isn’t greedy, during the middle of the US session they will close their positions so that the Big Money doesn’t come out and bring a “black swan” into the range of the Friday US session close—/ or before the opening of the Monday session. But for now, the indicators don’t say that something should happen. A correction is possible, but I don’t see a reversal and a drop the way the indicators showed before October 10.
📍 The nearest logical point on the chart is the previous lower high; will we already get a new HH, or will another LH show up with timing? Also, we need to wait for the formation of a new HL.
Keep an eye on updates in the comments to this post. I’m waiting for your well-reasoned opinion about this situation. Use my information only as a reference for how to approach market analysis—not as your own trading strategy or financial advice. Make your trades only based on your own analysis, experience, and conclusions. Green P&L to you, my crypto brothers 🙌.
✨✨✨
Thanks to all my crypto brothers who stay active and help me promote my content. If you like my creativity, you can support the author and the daily releases by subscribing, commenting, reposting, liking, or using the Tips feature. Thank you in advance 🙌

📝 Explanation of signal gradation:
Strongly positive (+3) — established, sustained positive signals across all indicators
Positive (+2) — positive signals on all indicators
Moderately positive (+1) — the start of forming positive signals; one strong positive signal is stronger than a negative one
Neutral (0) — the indicators repeat the price movements; the indicators are bidirectional with the same strength
Moderately negative (-1) — the start of forming negative signals; one strong negative signal is stronger than a positive one
Negative (-2) — negative signals on all indicators
Strongly negative (-3) — established, sustained negative signals across all indicators.