
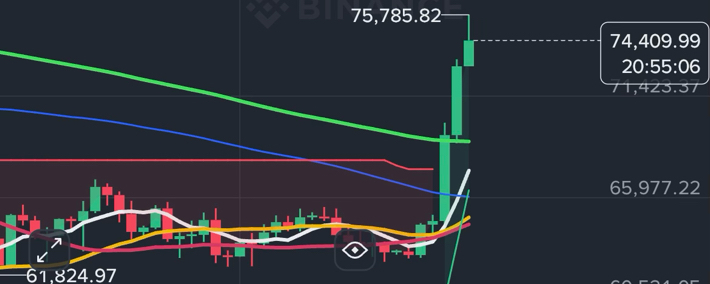
The important story is the feedback loop: crowded shorts → breakout → forced buying → higher price → more liquidations → short squeeze.
🚨 WHY DID SO MANY BTC SHORTS GET LIQUIDATED?
Bitcoin’s recent move from the low-$60Ks to above $70K–$74K was not simply a normal rally.
A major part of the acceleration came from a short squeeze.
🔻 What happened?
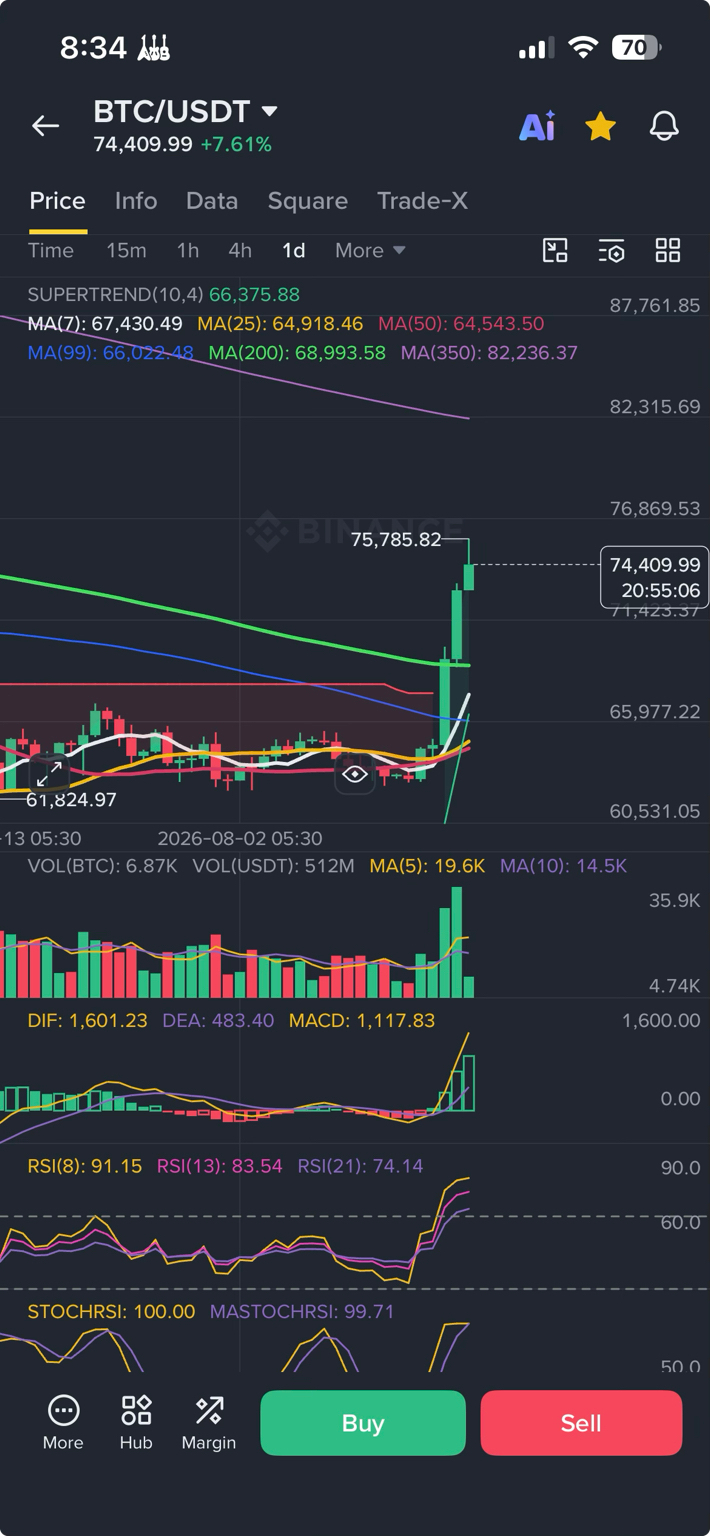
For weeks, BTC was trading in a relatively compressed range, with many traders positioning for another breakdown.
When BTC finally broke above the important $69K–$70K zone, leveraged short positions started getting liquidated.
And this creates a chain reaction:
BTC rises 📈
↓
Short positions move into loss
↓
Liquidation levels are triggered
↓
Exchanges forcibly close shorts by BUYING BTC
↓
BTC rises further
↓
More shorts get liquidated
↓
🔥 Short squeeze
This is why the move can become extremely violent in a very short period.
More than $1 billion of shorts were liquidated in roughly an hour during the initial surge, while reports put total crypto short liquidations over the following two days at around $3 billion.
📊 WHY WERE SHORTS SO VULNERABLE?
The technical setup was particularly dangerous for bears.
BTC had been trading below its 200-day moving average, and many traders were expecting the bearish trend to continue.
But once BTC reclaimed the 200-DMA around $69K, the market structure changed.
The breakout forced traders who were positioned for lower prices to exit.
And remember:
A short liquidation is a forced BUY.
That’s the important part.
Liquidations don’t merely remove losing positions — they create additional market buying pressure.
🧨 THE SHORT-SQUEEZE FUEL
The sequence looked approximately like this:
$62K–65K consolidation
⬇️
Bearish traders build short positions
⬇️
BTC breaks $65K
⬇️
Shorts begin losing
⬇️
BTC breaks $69K / 200-DMA
⬇️
🔥 Large-scale liquidations
⬇️
$70K → $72K → $74K
⬇️
More shorts forced to buy
⬇️
🔥🔥 Short squeeze
⚠️ BUT HERE IS THE IMPORTANT PART
A short squeeze doesn’t automatically mean a new bull market has begun.
The squeeze can produce an extremely fast move that temporarily pushes momentum indicators into overbought territory.
That’s exactly why I would watch the next move carefully.
If BTC pulls back and holds the $69K–70K area, the previous resistance can potentially become support.
That would be much more bullish than simply continuing vertically.
🎯 THE BIGGER TECHNICAL PICTURE
On the daily chart, the levels I am watching are:
$69K → 200-DMA
$75.8K → recent high / immediate resistance
$82.2K → 350-DMA ⭐
The 350-DMA is particularly important for the longer-term cycle structure.
If BTC eventually reclaims and holds the 350-DMA around $82.2K, the argument for a genuine long-term bull-market transition becomes much stronger.
So the question isn’t simply:
“How high can BTC go after the short squeeze?”
The bigger question is:
Can BTC convert the breakout into sustainable support?
If yes, this short squeeze may turn out to be the beginning of something much bigger rather than merely a liquidation-driven spike.
🔥 ONE-LINE SUMMARY
Shorts didn’t just lose because BTC went up — their forced BUYING helped push BTC even higher, creating the classic self-reinforcing short-squeeze cycle.
#Bitcoin #BTC #Crypto #ShortSqueeze #Liquidation #BTCUSDT #TechnicalAnalysis #BinanceSquare #CryptoTrading #BullMarket