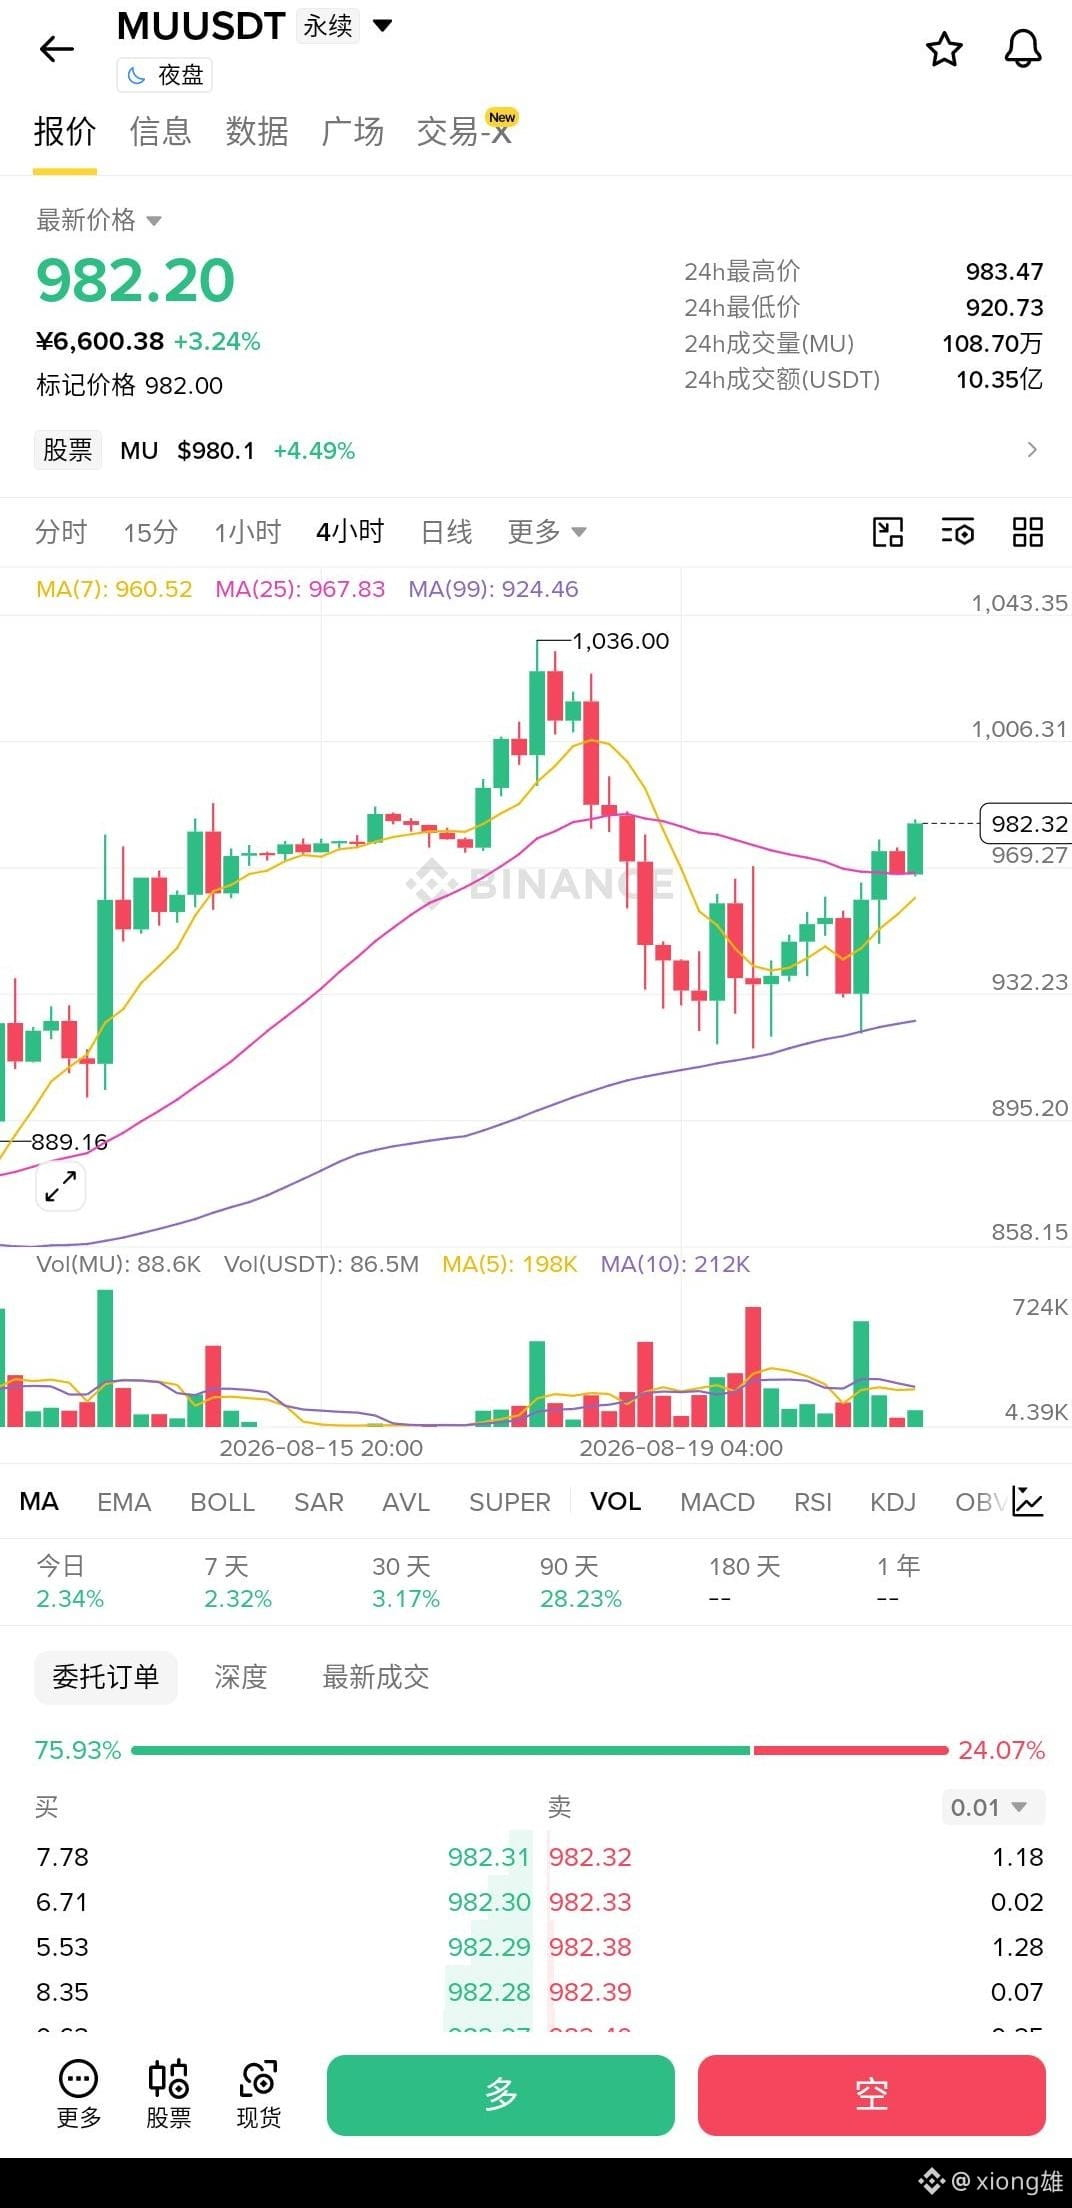
MU is currently around 982u, right under the 24-hour high of 983.47 and grinding there.
The past few days it was still sitting below the moving averages, but now it’s completely flipped—both the 20 and 50 moving averages are now directly underfoot. In the four-hour chart there have been four bullish candles and two bearish ones. On the daily chart, a single bullish candle sets the direction, lifting the price from 855 all the way to 982. This trend move looks like a real repair.
That said, what I care about more is how this rally came about. In one day, contract open interest dropped by nearly 8%, yet the price went up. Simply put, this isn’t money piling in. It looks more like short covering combined with leverage cleanup. Fees are still zero up to now, and longs still won’t pay even a fraction of the premium. The chasing funds aren’t that much.
The order book looks similar. For every buy order you see, there are only about half as many sell orders. The overhead resistance is right at the high of 983.47. Over at the large players’ accounts, more than 60% are still long, but in reality their positions are being reduced—they’ve kept a hand in reserve.
The upside is that there aren’t crowded long positions, so pullbacks usually won’t go too deep. The downside is that there’s still no volume backing a breakout above 983.47. Whether it’s truly started is still uncertain.
So I won’t chase at this level. Either wait for a volume-backed breakout above 983.47, or wait for a retest down to around 975 near the 20-day moving average and only enter if it doesn’t break. The risk-reward is better. Bias is bullish, but entry requires patience.
#mu $MU
The past few days it was still sitting below the moving averages, but now it’s completely flipped—both the 20 and 50 moving averages are now directly underfoot. In the four-hour chart there have been four bullish candles and two bearish ones. On the daily chart, a single bullish candle sets the direction, lifting the price from 855 all the way to 982. This trend move looks like a real repair.
That said, what I care about more is how this rally came about. In one day, contract open interest dropped by nearly 8%, yet the price went up. Simply put, this isn’t money piling in. It looks more like short covering combined with leverage cleanup. Fees are still zero up to now, and longs still won’t pay even a fraction of the premium. The chasing funds aren’t that much.
The order book looks similar. For every buy order you see, there are only about half as many sell orders. The overhead resistance is right at the high of 983.47. Over at the large players’ accounts, more than 60% are still long, but in reality their positions are being reduced—they’ve kept a hand in reserve.
The upside is that there aren’t crowded long positions, so pullbacks usually won’t go too deep. The downside is that there’s still no volume backing a breakout above 983.47. Whether it’s truly started is still uncertain.
So I won’t chase at this level. Either wait for a volume-backed breakout above 983.47, or wait for a retest down to around 975 near the 20-day moving average and only enter if it doesn’t break. The risk-reward is better. Bias is bullish, but entry requires patience.
#mu $MU