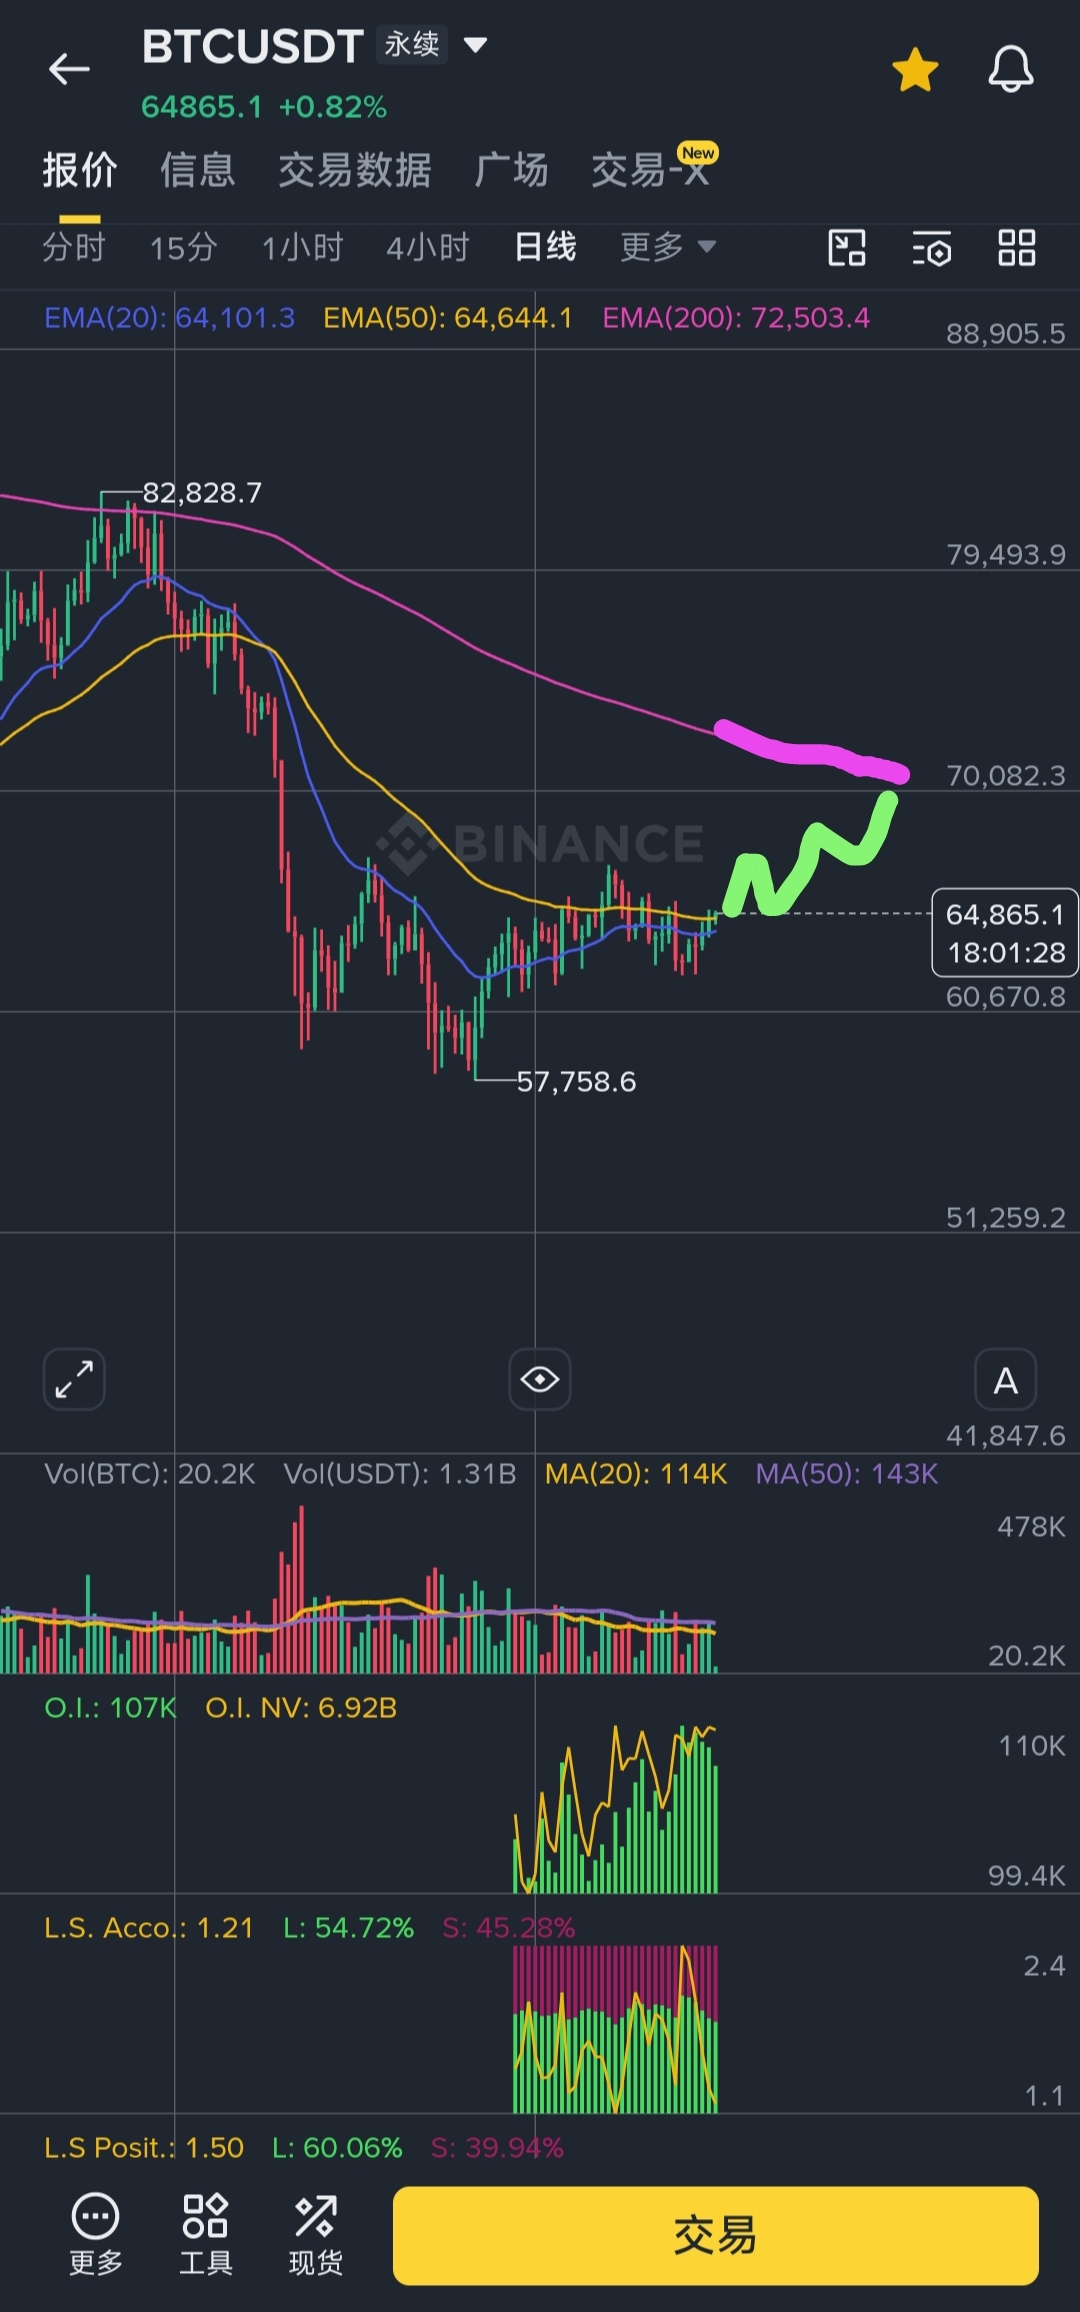
On August 6, I said: $BTC
This month’s monthly line high will be around 70K, and it will test the selling pressure of the EMA200. The result was a streak of 10 consecutive days of declines, then after dropping to 62,500 it一路 rose.
If this BTC uptrend continues and the subsequent pullback doesn’t break 70,000—forming support—then by the end of the month we can see BTC at 75,000. Conversely, if the pullback breaks down and 70,000 turns into a resistance level, then in September or October we could see BTC at 60,000, or even lower. No matter how September and October play out, after November begins the next four-year cycle.
That day I also said: $SNDK If you don’t hold 1,200, you can see 1,000. The outcome was a fake breakdown, followed by a rise to 1,800. Now it’s fallen again to 1,560. If the subsequent rebound doesn’t break 1,680, then we could see 1,250 or even lower for the Sand.
This month’s monthly line high will be around 70K, and it will test the selling pressure of the EMA200. The result was a streak of 10 consecutive days of declines, then after dropping to 62,500 it一路 rose.
If this BTC uptrend continues and the subsequent pullback doesn’t break 70,000—forming support—then by the end of the month we can see BTC at 75,000. Conversely, if the pullback breaks down and 70,000 turns into a resistance level, then in September or October we could see BTC at 60,000, or even lower. No matter how September and October play out, after November begins the next four-year cycle.
That day I also said: $SNDK If you don’t hold 1,200, you can see 1,000. The outcome was a fake breakdown, followed by a rise to 1,800. Now it’s fallen again to 1,560. If the subsequent rebound doesn’t break 1,680, then we could see 1,250 or even lower for the Sand.