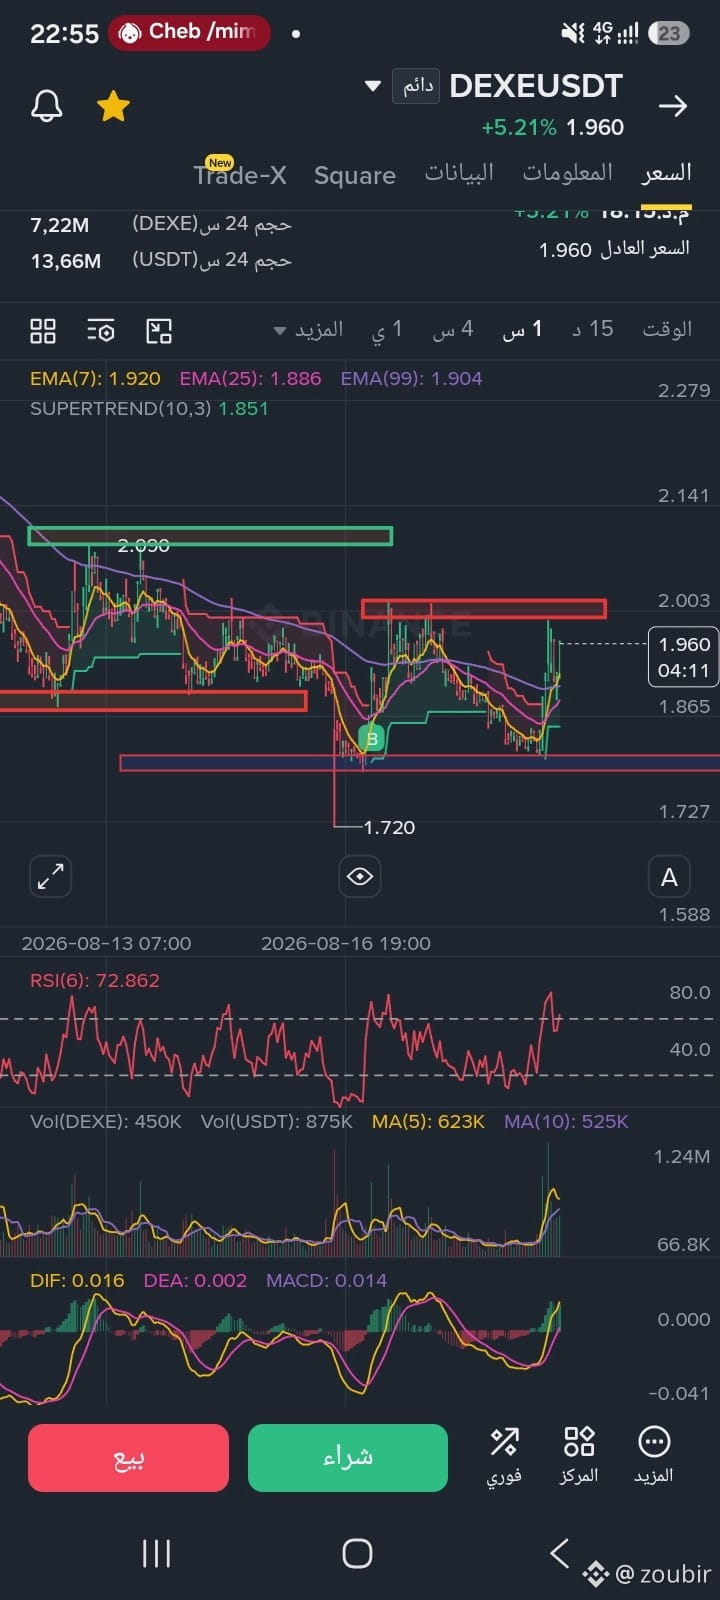
$DEXE Technical Indicator Analysis
Exponential Moving Averages (EMA):
The current price (1.960) is trading above the three moving-average lines shown: EMA(7) at 1.920, EMA25 at 1.886, and EMA(99) at 1.904.
The price moving up above these combined lines is considered a positive signal that supports bullish momentum in the short term, but the convergence of these lines suggests the price is exiting the accumulation phase.
Relative Strength Index (RSI):
The current value of the RSI(6) indicator is 72.86.
When the indicator moves above the 70 level, it means the coin has reached the overbought zone (Overbought). This reflects very strong upward momentum, but at the same time it warns of the possibility of a temporary bearish correction or profit-taking at the current resistance areas.
MACD Indicator (MACd:
The MACD line (DIF: 0.016) crosses positively above the signal line (DEA: 0.002), with the green histogram bars clearly growing above the zero line. This confirms that buyers are still in control and buying power is increasing at the moment.💡 Proposed Technical Outlook
The bullish positive scenario requires continued upward movement: the four-hour candle close, or the current candle according to the timeframe used, should be clearly above the 2.003 USDT level. If the breakout succeeds, the next target would be to test 2.090 USDT, then 2.141 USD.
The corrective (bearish) scenario: since the price is near a strong red resistance and the RSI indicator has reached the $NVDAB overbought stage, a pullback that corrects the move is expected to occur
Exponential Moving Averages (EMA):
The current price (1.960) is trading above the three moving-average lines shown: EMA(7) at 1.920, EMA25 at 1.886, and EMA(99) at 1.904.
The price moving up above these combined lines is considered a positive signal that supports bullish momentum in the short term, but the convergence of these lines suggests the price is exiting the accumulation phase.
Relative Strength Index (RSI):
The current value of the RSI(6) indicator is 72.86.
When the indicator moves above the 70 level, it means the coin has reached the overbought zone (Overbought). This reflects very strong upward momentum, but at the same time it warns of the possibility of a temporary bearish correction or profit-taking at the current resistance areas.
MACD Indicator (MACd:
The MACD line (DIF: 0.016) crosses positively above the signal line (DEA: 0.002), with the green histogram bars clearly growing above the zero line. This confirms that buyers are still in control and buying power is increasing at the moment.💡 Proposed Technical Outlook
The bullish positive scenario requires continued upward movement: the four-hour candle close, or the current candle according to the timeframe used, should be clearly above the 2.003 USDT level. If the breakout succeeds, the next target would be to test 2.090 USDT, then 2.141 USD.
The corrective (bearish) scenario: since the price is near a strong red resistance and the RSI indicator has reached the $NVDAB overbought stage, a pullback that corrects the move is expected to occur