


Current Situation
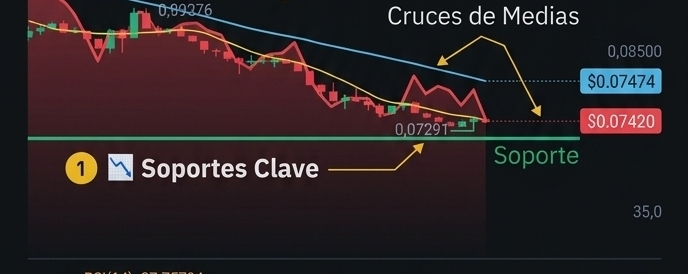
$ZBT is located at $0,0742, maintaining a short-term bearish structure with a drop of -2,71%.
Key Indicators
* Moving Averages (MA): The MAs of 7 ($0,0747), 30 ($0,0814) and 200 ($0,1041) are aligned in a cascading manner above the price. The immediate trend remains pressured to the downside until the price breaks above the MA(7).
* RSI (14): Marking 27,75, the asset is in an extreme oversold zone. Historically, these levels often anticipate a technical rebound or temporary buying relief.
* MACD: Shows a very modest green histogram (0,00016), suggesting a gradual exhaustion in sell strength, though still without a decisive bullish crossover.
Operational Levels
* Support: $0,0729 (Key recent low). If it loses this level, it could seek new market lows.
* Immediate Resistance: $0,0747 (MA7) and subsequently $0,0814 (MA30).
Outlook
The oversold zone in the RSI opens the door to a short-term technical rebound toward $0,078 - $0,081. However, to confirm a trend recovery, it requires buy volume that breaks the resistance of the 30-period MA.
Prudent risk management in the face of volatility.