
Perpetual Contract | 15-Minute Chart | Binance
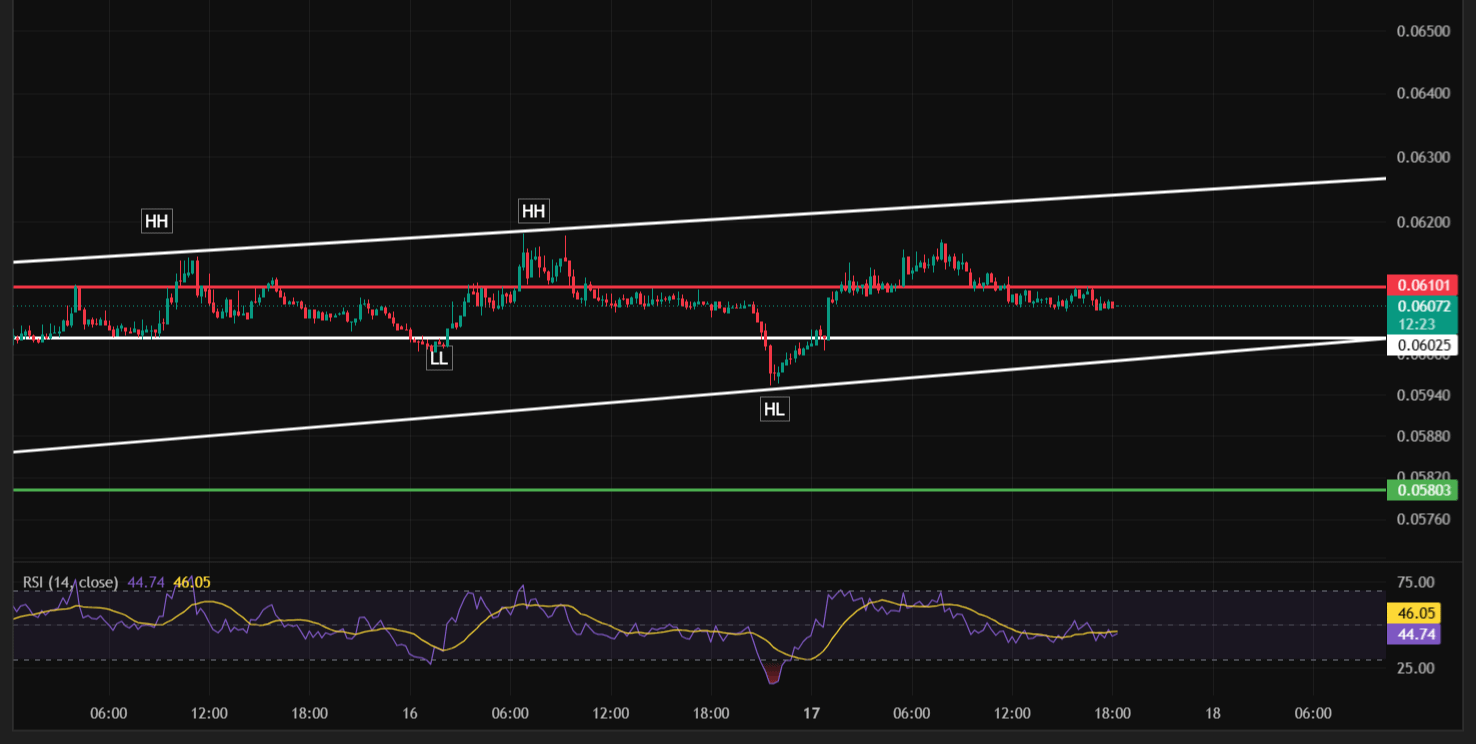
LAYER/USDT has spent the past two days oscillating inside a well-defined rising wedge, bouncing between a gently ascending upper trendline and a steeper rising lower trendline while repeatedly testing the same horizontal levels. Price is currently trading around $0.06074, essentially flat on the session, sitting right in the middle of its recent range with RSI holding a neutral 45.12–46.12.
Market Structure
The pattern here is a textbook rising wedge. Since the first Higher High near $0.0610 two days ago, LAYER has traced a sequence of Higher Highs and Higher Lows — a Lower Low near $0.0600, followed by a fresh Higher High above $0.0615, then a sharper pullback into a Higher Low around $0.0592, and most recently another push back up to retest the same $0.0610 resistance zone. Each swing has stayed contained between the two converging trendlines, with the upper line capping rallies near $0.0610–$0.0615 and the lower line supporting dips in the $0.0592–$0.0602 area.
Rising wedges like this can resolve in either direction, and what makes the current setup notable is that RSI has stayed range-bound between roughly 25 and 65 throughout, never confirming strong directional momentum. That kind of indecision inside a converging pattern typically means the eventual breakout — whichever way it goes — is likely to be a meaningful move once it happens.
Key Levels to Watch
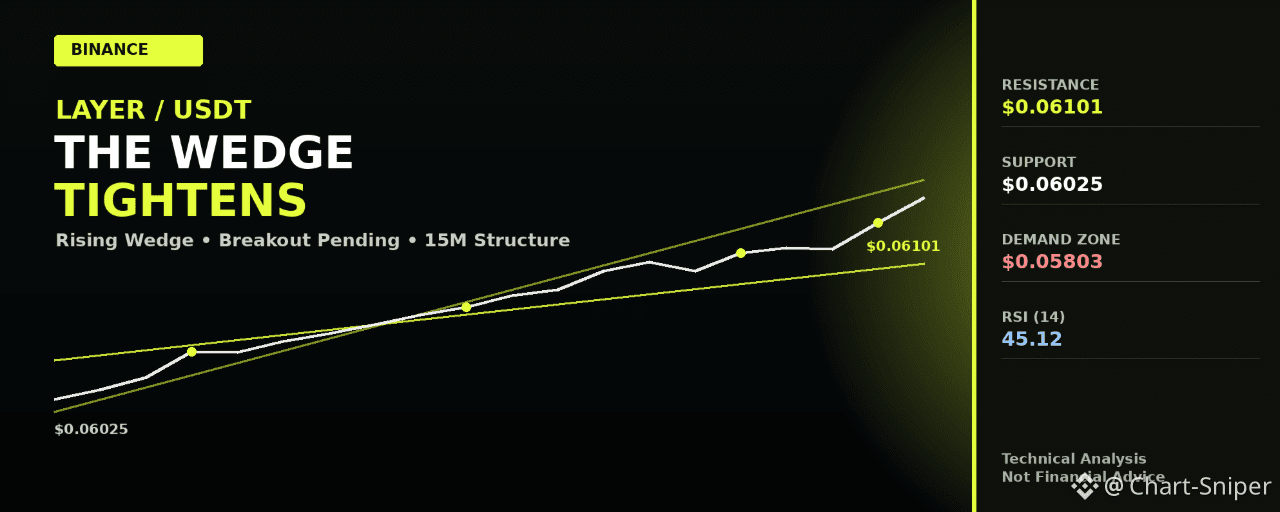
Immediate resistance: $0.06101 — the level price is currently testing and the top of the recent consolidation range.
Wedge resistance: the upper trendline, currently intersecting near $0.0615–$0.0620 and rising slowly over time.
Immediate support: $0.06025 — the lower boundary of the current consolidation and the first line of defense on a pullback.
Major support: $0.05803 — a well-defined horizontal demand zone well below the wedge; a break of the wedge's lower trendline would put this level back in focus.
Trade Setup Ideas
Range support long (tactical) A pullback into the $0.06025–$0.06050 zone that holds with a bullish reversal candle offers a tactical long back toward $0.06101, with a stop below $0.05990 to protect against a deeper break of the wedge's lower trendline.
Breakout continuation long A decisive 15-minute close above $0.06101 with rising volume and RSI pushing through 55–60 would confirm the range has resolved bullish, opening room toward the upper wedge trendline near $0.0615–$0.0620. Waiting for a retest of $0.06101 as new support offers a lower-risk entry than chasing the initial breakout candle.
Breakdown scenario (bearish resolution) A clean break and close below the rising lower trendline and $0.06025 would signal the wedge is resolving to the downside, often a bearish outcome for this pattern type, opening a path toward $0.05803. In that case, a short entry on a retest of the broken trendline as new resistance, with a stop above $0.06070, targets the $0.05803 support zone.
The Bigger Picture
LAYER/USDT remains coiled inside a rising wedge with no clear directional edge yet, making the $0.06101 resistance and $0.06025 support the two levels that matter most right now. A confirmed break above $0.06101 favors continuation toward $0.0615–$0.0620, while a break below the rising trendline and $0.06025 would point toward a larger correction down to $0.05803 — patience for a clean break in either direction is the more disciplined approach here.
Disclaimer: This article is for educational and informational purposes only and does not constitute financial advice. Cryptocurrency perpetual futures are highly leveraged, volatile instruments and carry a substantial risk of loss. Always conduct your own research, manage your risk carefully, and consult a licensed financial advisor before making any trading decision.
@Binance Square Official #BitcoinHoldsNear$63500 #ChinaJulyOutputRetailInvestmentAllMiss #CMESeptemberHikeOddsFallTo30.6% #Binance #ChartSniper