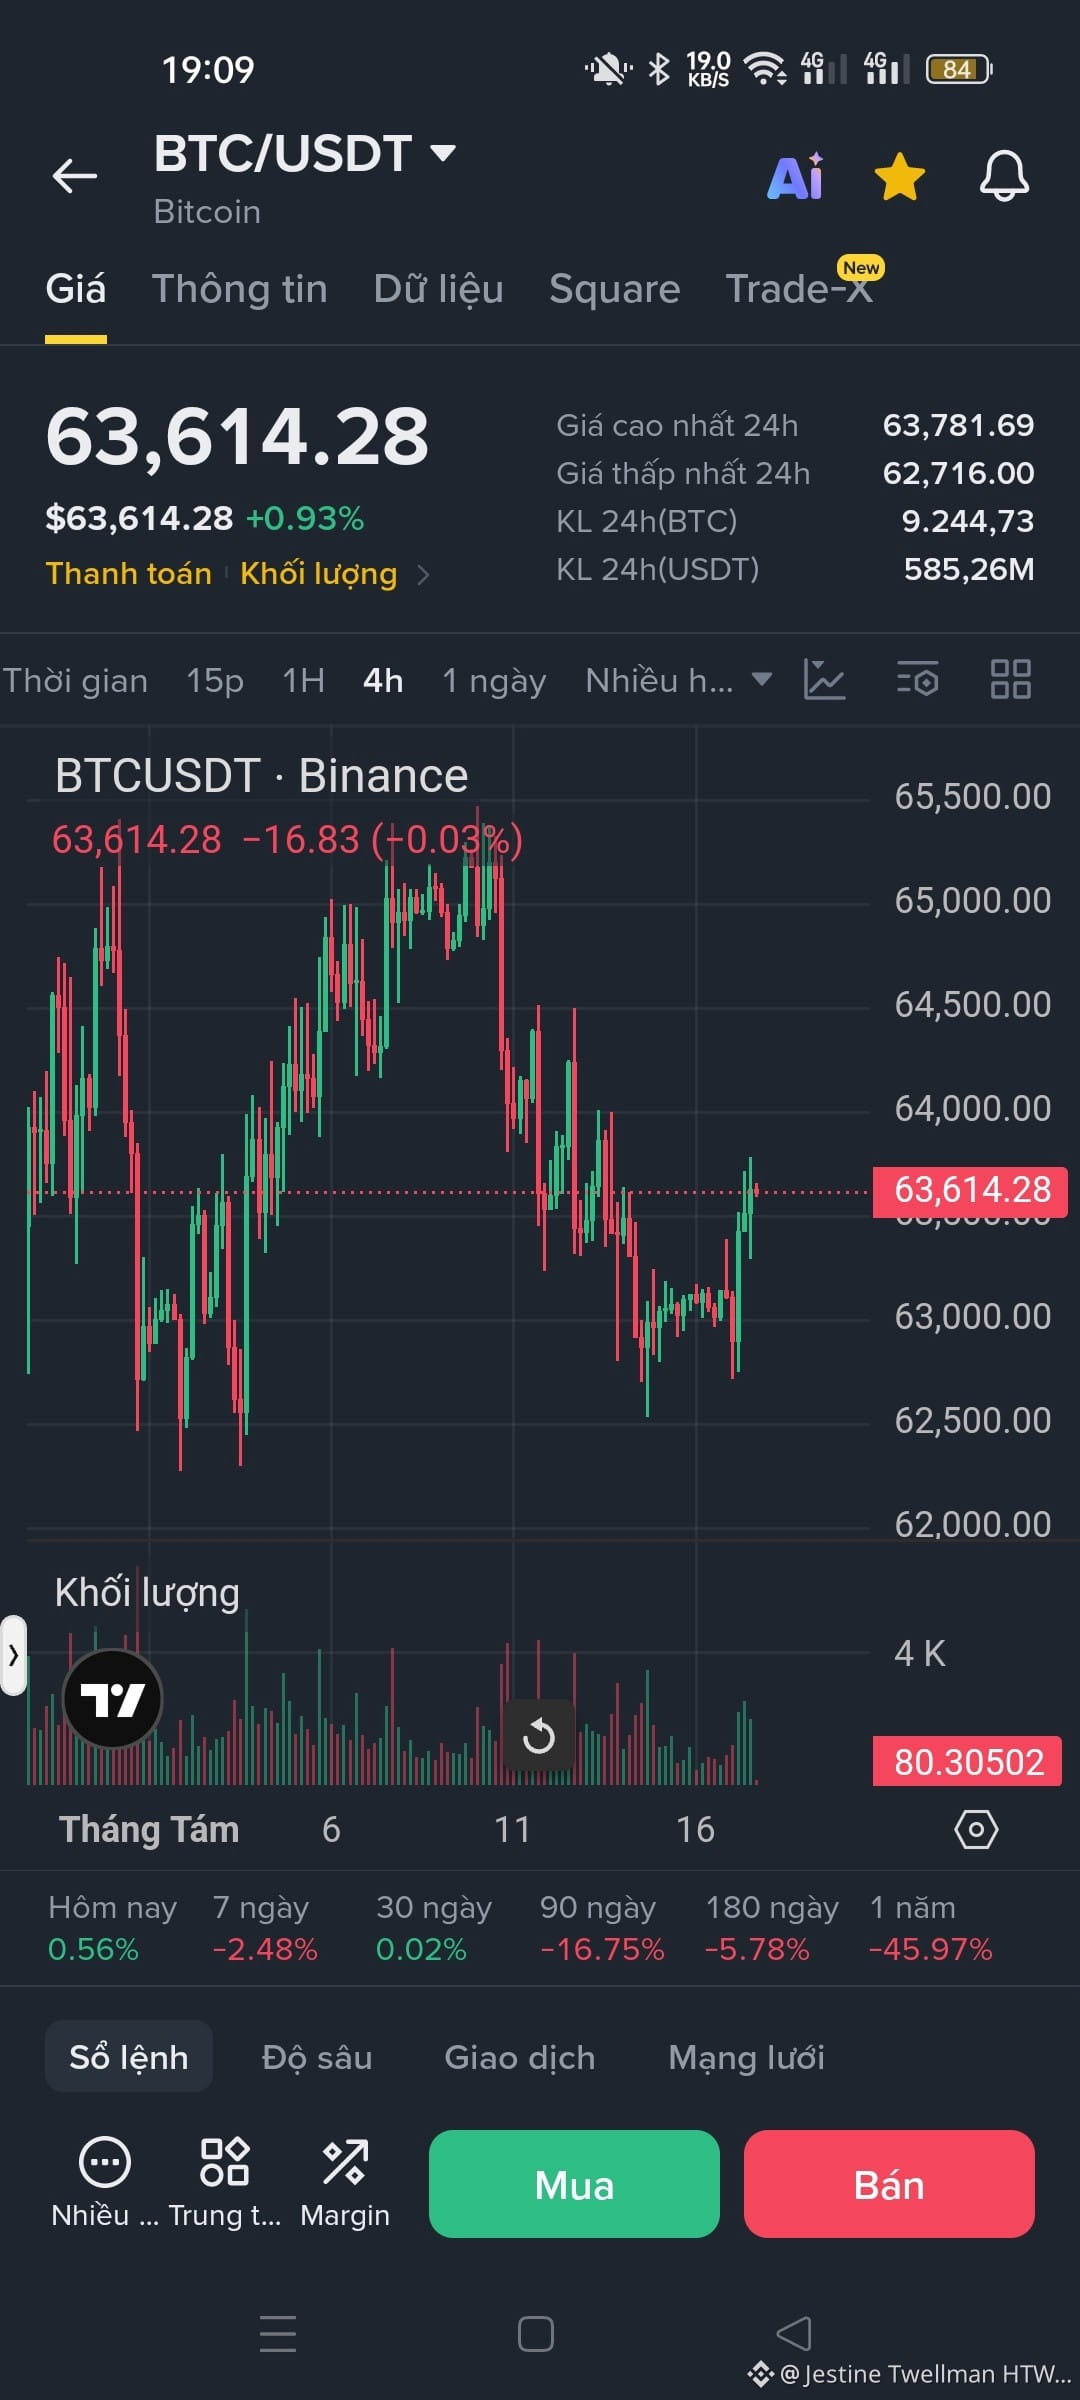
$BTC Currently, BTC is trading around $63,614, and the 4-hour (4H) chart is showing us extremely notable signs of the potential for continued upside:
Successfully defending the support zone: Price dipped down to the $62,700 area (with the 24h low at $62,716), but immediately, the bulls stepped in strongly. The wick rejection and rebound suggest this price zone has very solid demand for bottoming.
Momentum reversal: On the 4H timeframe, we’re seeing fairly firm green candles bouncing back. The blue color isn’t extremely large yet, but it’s enough to confirm that selling pressure appears to have run out in the lower price area.
Accumulation pattern awaiting a breakout: Price is compressing after a period of volatility. If BTC can continue holding above the $63,500 level and break through the psychological resistance around $64,500 to $65,000, the door to revisiting the previous highs is wide open!
🔥 Expected scenario: The recent shake-out could just be the necessary “spring” to build momentum. Market volume is waiting for a confirmation signal to explode.
What do you think, everyone? Will BTC keep ranging and accumulating, or is it gearing up for a strong upward jump this week? Drop your opinions and trading strategies in the comments below! 👇
Note: This article is for reference only—based on personal viewpoints from technical analysis at the current time—and is not investment advice (NFA). Always do your own research (DYOR) before putting money in! 🛡️
#Bitcoin #BTC #TechnicalAnalysis #BinanceSquare #CryptoTrading
Successfully defending the support zone: Price dipped down to the $62,700 area (with the 24h low at $62,716), but immediately, the bulls stepped in strongly. The wick rejection and rebound suggest this price zone has very solid demand for bottoming.
Momentum reversal: On the 4H timeframe, we’re seeing fairly firm green candles bouncing back. The blue color isn’t extremely large yet, but it’s enough to confirm that selling pressure appears to have run out in the lower price area.
Accumulation pattern awaiting a breakout: Price is compressing after a period of volatility. If BTC can continue holding above the $63,500 level and break through the psychological resistance around $64,500 to $65,000, the door to revisiting the previous highs is wide open!
🔥 Expected scenario: The recent shake-out could just be the necessary “spring” to build momentum. Market volume is waiting for a confirmation signal to explode.
What do you think, everyone? Will BTC keep ranging and accumulating, or is it gearing up for a strong upward jump this week? Drop your opinions and trading strategies in the comments below! 👇
Note: This article is for reference only—based on personal viewpoints from technical analysis at the current time—and is not investment advice (NFA). Always do your own research (DYOR) before putting money in! 🛡️
#Bitcoin #BTC #TechnicalAnalysis #BinanceSquare #CryptoTrading