
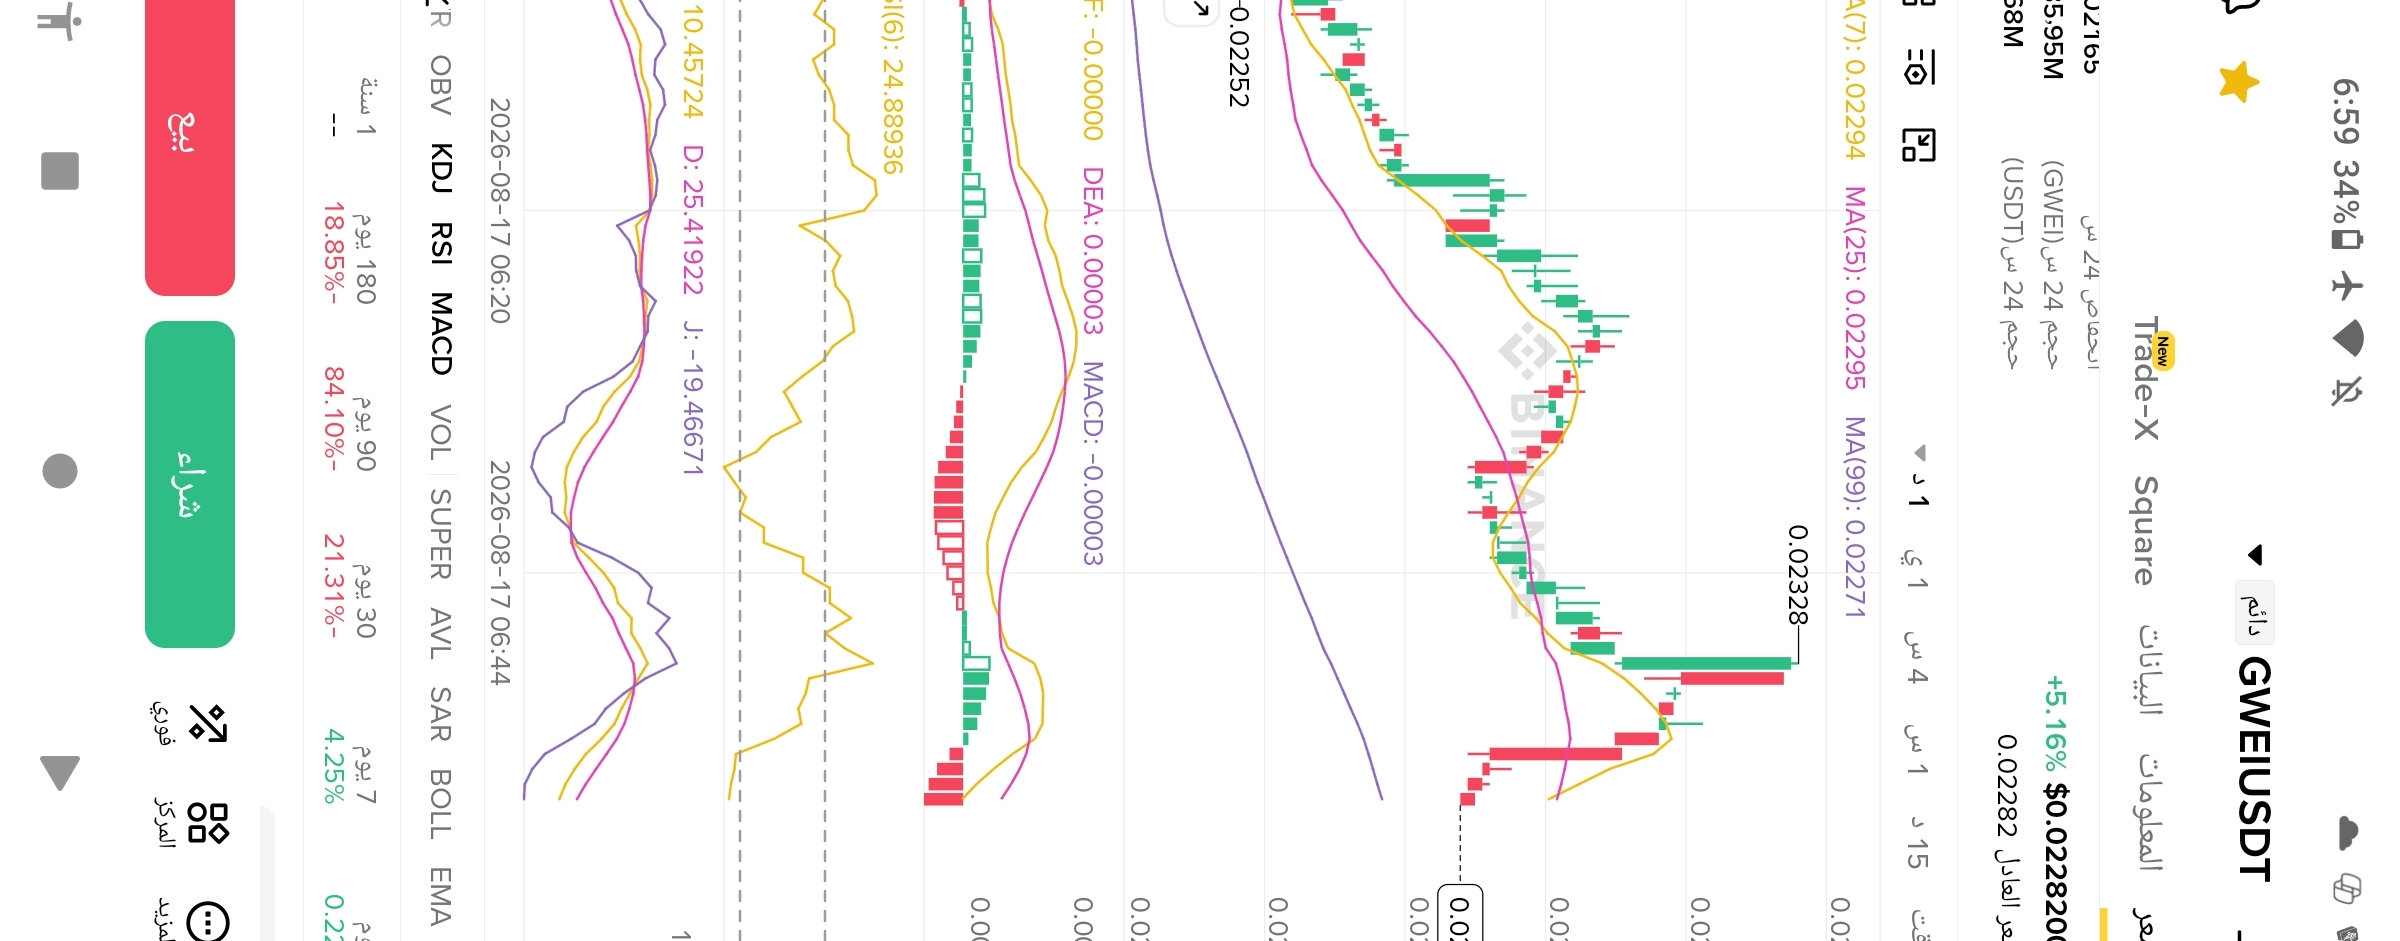
Analysis of the GWEIUSDT candle # Timeframe 1D - 06:59
1. Current candle data
Current price: 0.02282
24h change: +5.16%
2. The range and the degree for the last drop
Based on the peak 0.02328 and the trough 0.02282:
The item Value Analysis
**Range** 1.97% Very large range
**Degree** -45° approximately Strong sharp decline
**Move name** Collapse Institutional selling out of fear
Calculation:
`Range = (0.02328 - 0.02282) / 0.02328 = 1.97%`
`Degree = sharp -45°` because it dropped 46 points in only 8-10 candles
3. Angle analysis - 45° law
Drawn from the top of `0.02328`:
1. The downward 45° 1x1 angle: the price should be at 0.02295 right now
Price below it at 0.02282 = it breaks it strongly = weakness
2. The downward angle 63° 2x1: the second line. If it breaks it = we go to 0.02255
3. The downward angle 26° 1x2: support. If it bounces from it = correction
Summary: The price broke the 45° quadrilateral angle with a candle whose range is 1.97% = full seller control
4. Indicator confirmation
1. KDJ: K=10.45 D=25.41 J=-19.46 = strong oversold
2. RSI(6): 24.88 = strong oversold
3. MACD: DIF -0.00000 below DEA = a sell crossover
4. Moving averages: price is below MA7 and MA25 and MA99 = downtrend
5. Final decision
`-45° angle + 1.97% range + oversold` = strong drop but exhausting
Scenarios:
1. Ongoing drop of 60%: if it breaks 0.02274 = target 0.02255
2. 40% bounce: the range is large + oversold = possible bounce to 0.02294 MA7 before it continues
Trading rule:
- Don’t sell now: the 1.97% range is large, selling is late
- Don’t buy now: below all moving averages and the angle is broken
- Best: wait. Either it bounces back to 0.02294 and you sell, or it breaks 0.02274 and you continue
The market is in a small "pump". Wait and watch until the range calms down.