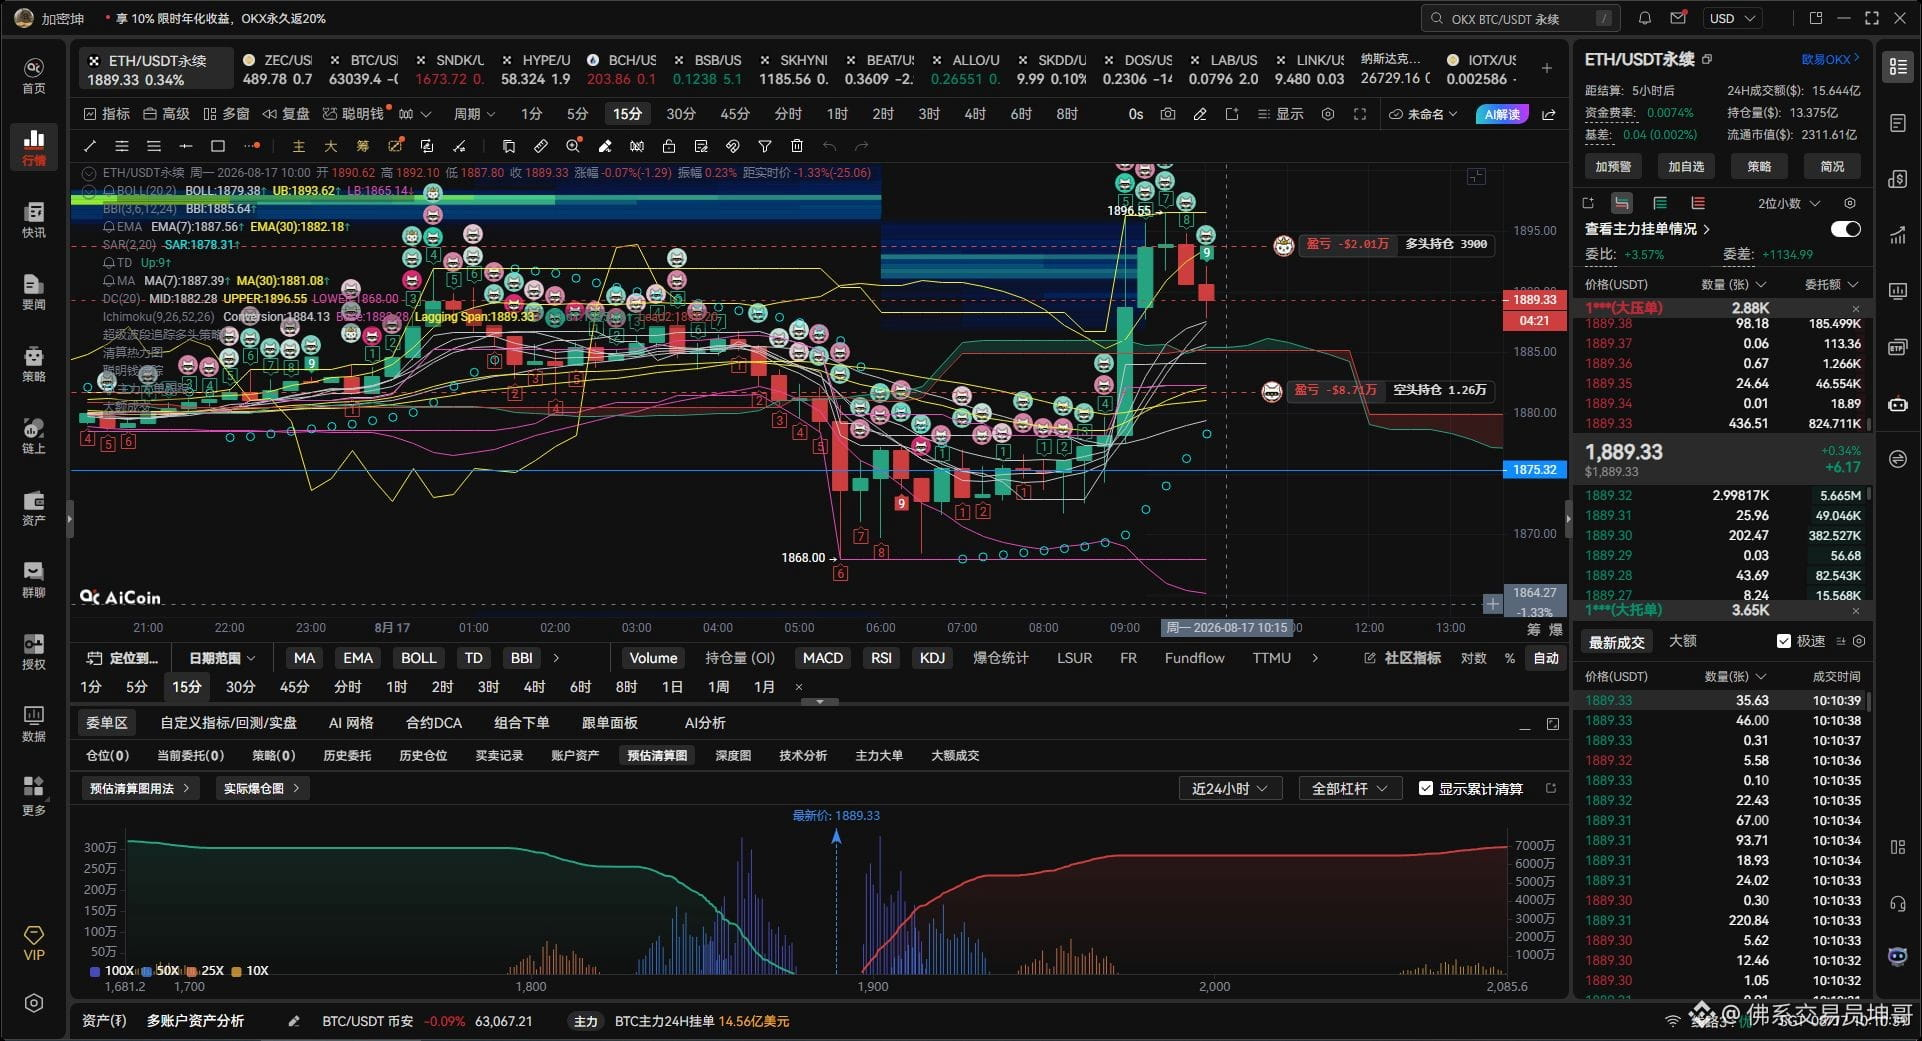
8-17【$ETH Daily trend】
Candlestick pattern:
On the daily timeframe, a double-bottom structure has recently formed. The support zone is defined by the low on August 5 (1854.51) and the low on August 10 (1866.14).
On the hourly chart, an upward channel has appeared. After the current price broke above the 1880 psychological level, it tested the key resistance at 1900.
Technical indicators:
The MACD daily line shows an initial golden cross (DIF 7.32 crossing above DEA 12.14), but the histogram is still negative (-9.65). Watch for whether this momentum can sustain.
RSI(14) rebounded from the oversold area to a neutral level of 52.53. On the hourly chart, RSI briefly touched 63 and then pulled back, indicating short-term overbought conditions.
EMA7 (1884) is about to cross above EMA30 (1874). The 120-day moving average (1954) is still exerting significant downward pressure.
Trading volume:
On August 10, the market saw a sharp drop accompanied by a peak volume of 3.37 million. In the recent rebound, the volume has shrunk to around the 370k level.
On the hourly chart, a breakout early in the session had volume support around 280k, but subsequent volume strength has been insufficient.
Candlestick pattern:
On the daily timeframe, a double-bottom structure has recently formed. The support zone is defined by the low on August 5 (1854.51) and the low on August 10 (1866.14).
On the hourly chart, an upward channel has appeared. After the current price broke above the 1880 psychological level, it tested the key resistance at 1900.
Technical indicators:
The MACD daily line shows an initial golden cross (DIF 7.32 crossing above DEA 12.14), but the histogram is still negative (-9.65). Watch for whether this momentum can sustain.
RSI(14) rebounded from the oversold area to a neutral level of 52.53. On the hourly chart, RSI briefly touched 63 and then pulled back, indicating short-term overbought conditions.
EMA7 (1884) is about to cross above EMA30 (1874). The 120-day moving average (1954) is still exerting significant downward pressure.
Trading volume:
On August 10, the market saw a sharp drop accompanied by a peak volume of 3.37 million. In the recent rebound, the volume has shrunk to around the 370k level.
On the hourly chart, a breakout early in the session had volume support around 280k, but subsequent volume strength has been insufficient.