⚠️ $BTC IN THE IMPACT ZONE: THE LIQUIDITY MAP AND THE TRADERS RATIO REVEAL THE NEXT SWEEP ⚠️
When we cross-reference leveraged positioning data with the order heatmap, the picture for Bitcoin becomes crystal clear. This is not a neutral phase—this is a liquidity compression on the verge of exploding.
📌 CONNECTION OF KEY METRICS:
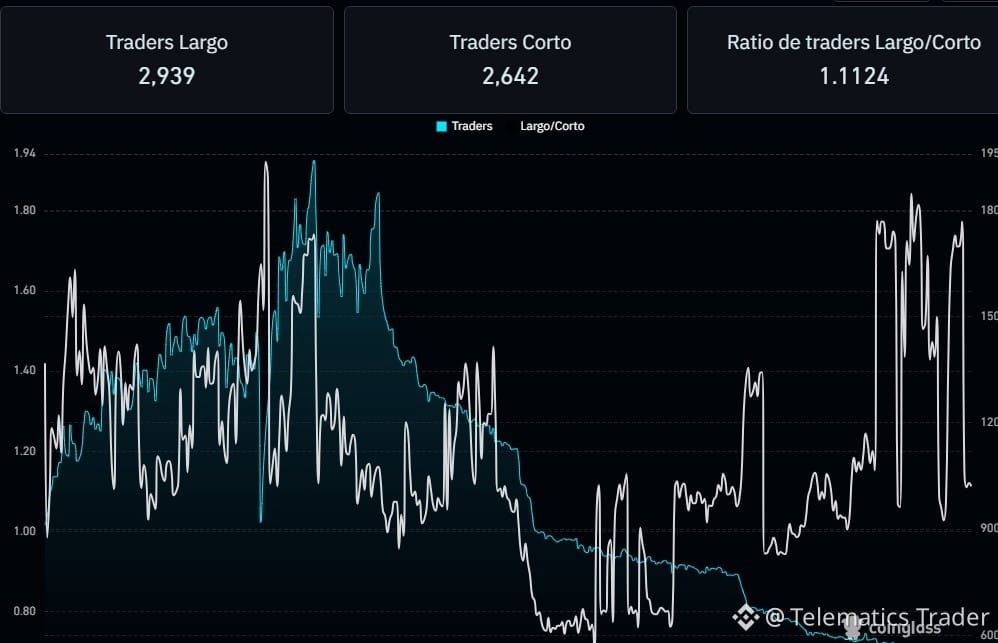
📊 The Leveraged Crowd (Ratio 1.1124): With 2,939 traders positioned Long versus 2,642 Short, most of the retail market maintains an immediate bullish bias.
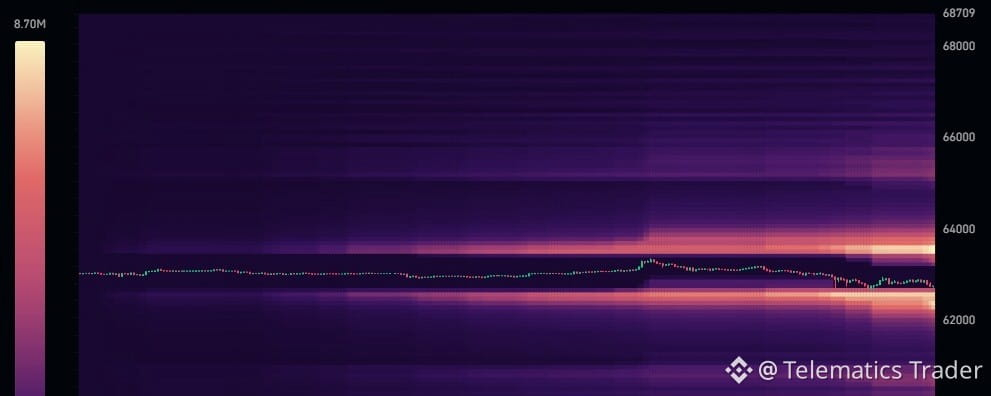
🔥 The Trap in the Heatmap: The liquidity chart shows two gigantic walls compressing the price. Above, a fierce resistance at $63,800 - $64,000; below, a dense pool of stop-losses defending the $62,500 - $62,800.
📌 WHAT DOES THIS MEAN FOR YOUR TRADING?
The market always seeks the highest concentration of money to execute liquidations. Since the ratio is tilted toward long positions, the risk of a stop-hunt toward $62,500 is high before any real upside move with actual volume.
💡 Strategy: Avoid opening leveraged positions in the middle of the range. Waiting for price to visit and clear one of the two heatmap bands provides the only clearly defined mathematical edge.
When we cross-reference leveraged positioning data with the order heatmap, the picture for Bitcoin becomes crystal clear. This is not a neutral phase—this is a liquidity compression on the verge of exploding.
📌 CONNECTION OF KEY METRICS:
📊 The Leveraged Crowd (Ratio 1.1124): With 2,939 traders positioned Long versus 2,642 Short, most of the retail market maintains an immediate bullish bias.
🔥 The Trap in the Heatmap: The liquidity chart shows two gigantic walls compressing the price. Above, a fierce resistance at $63,800 - $64,000; below, a dense pool of stop-losses defending the $62,500 - $62,800.
📌 WHAT DOES THIS MEAN FOR YOUR TRADING?
The market always seeks the highest concentration of money to execute liquidations. Since the ratio is tilted toward long positions, the risk of a stop-hunt toward $62,500 is high before any real upside move with actual volume.
💡 Strategy: Avoid opening leveraged positions in the middle of the range. Waiting for price to visit and clear one of the two heatmap bands provides the only clearly defined mathematical edge.