Let’s first talk about the research conclusion:
Currently, BTC is still in a 'weak structural waiting period'. There is liquidation above, but the risk below has not yet been released and is significantly heavier. The rebound is more of an indicator repair, not a trend and direction choice.
Before the structure truly changes, every time it peaks, it seems to provide better positions for short sellers.
Yesterday's market review:
Last night, after the US stock market opened, the market symbolically pulled up a bit, but soon became 'unable to keep up'.
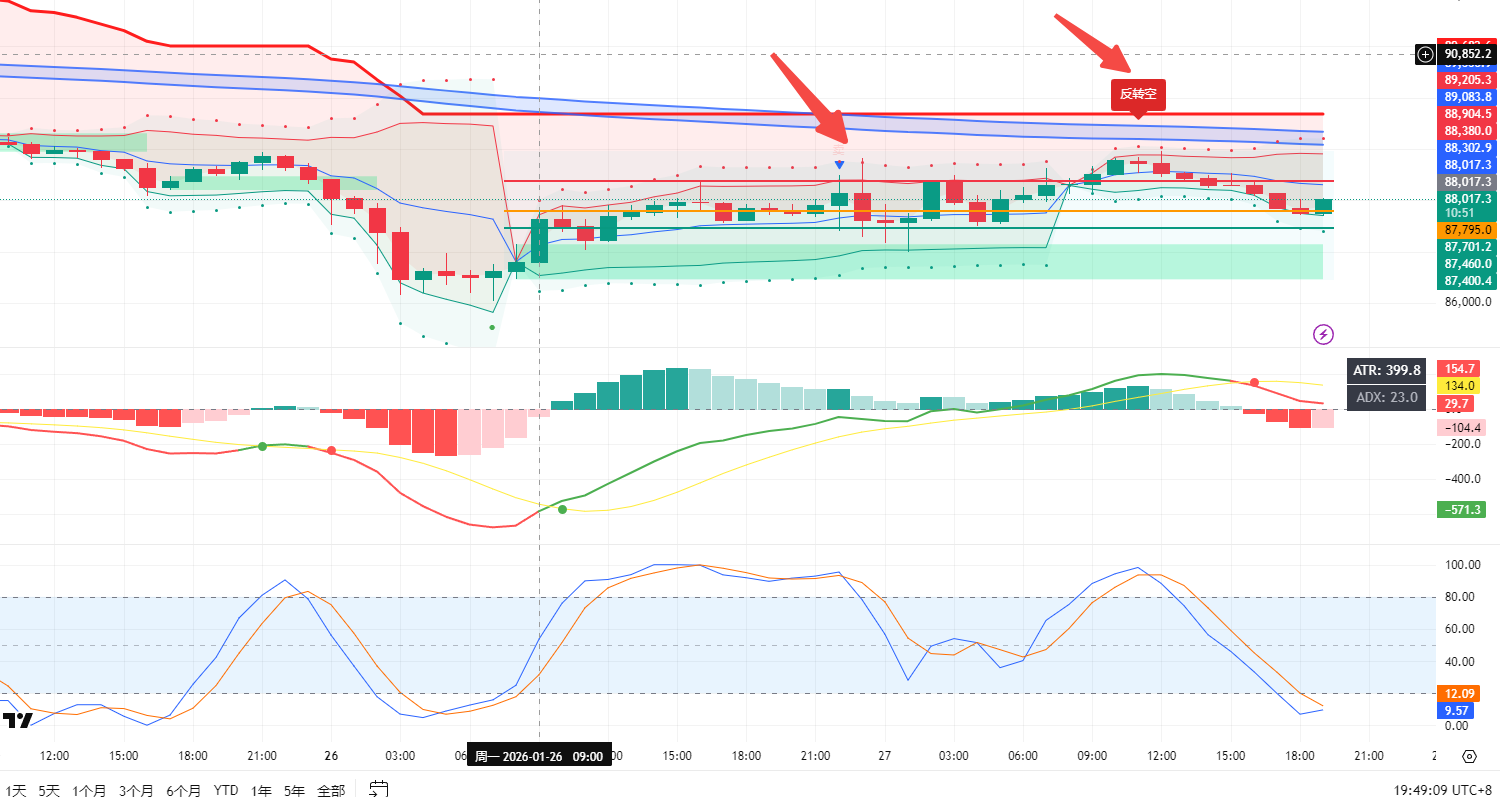
In the 15-minute level, there hasn’t been a single solid candlestick that truly stands above '88550'. The dual pressure from Vegas combined with POC acts like two ceilings pressing down on the price—each time it looks like it's going to break through, but in reality, it gets pushed back to its original position.
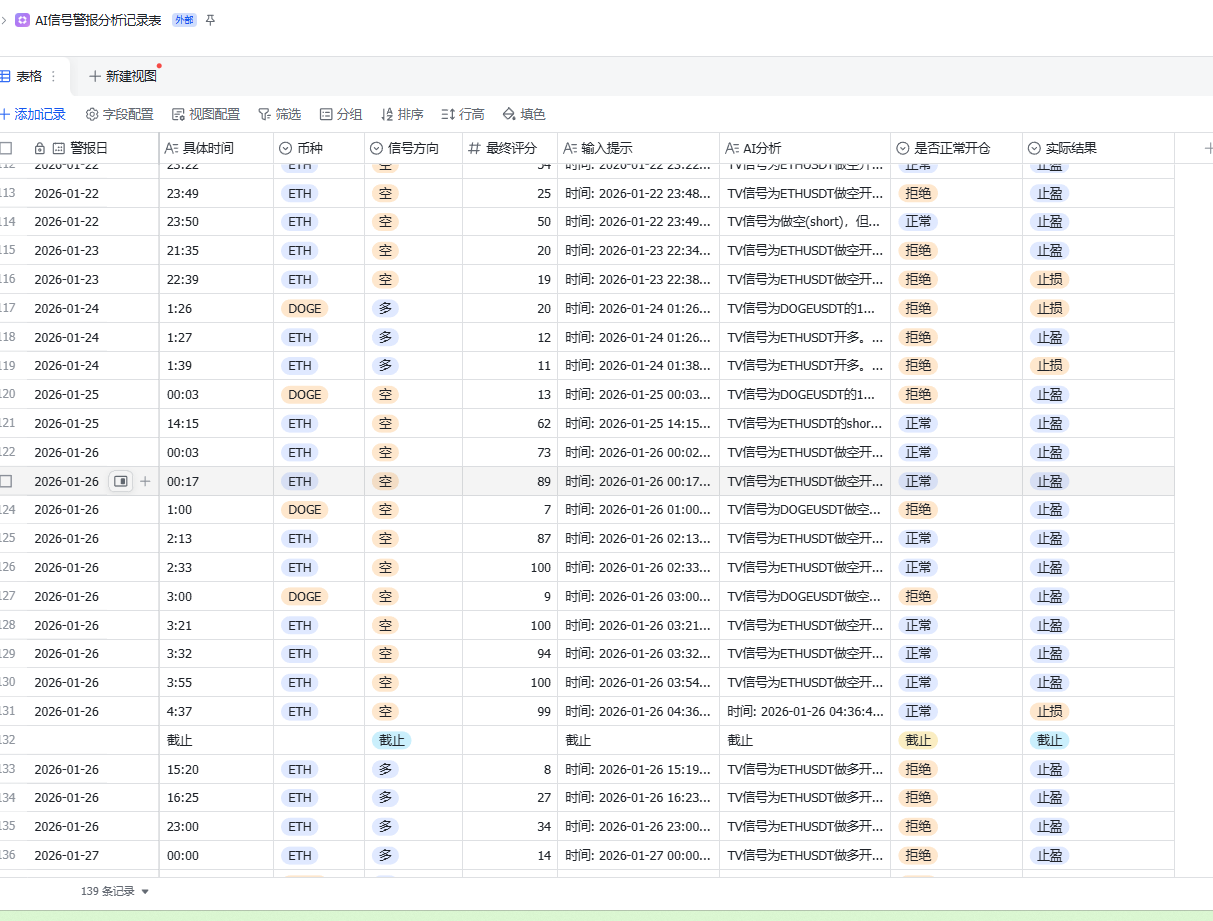
AI trading also gave me a very typical 'weak reversal short' signal (P2 blue small triangle), that said AI has gone through continuous optimization, and the recent win rate has been improving, indeed positive feedback can bring momentum!
Immediately, I followed the short idea I discussed yesterday and made about 1000 points before withdrawing, considered a small red packet from the market
The only regret is that the cleaner reversal short this morning happened while I was still catching up on sleep, resulting in missing it—sure enough, the market doesn't wait for anyone, and BTC is also unforgiving
BTC current price: about 87,700 – 87,800
1. Structural Status: Still weak digestion, not a trend recovery
🔻 4H structure
Clearly belongs to the consolidation phase after a decline
No elevation at the high point
No structural reclaim at the low point
Belongs to a post-decline adjustment and rest, not a strong turn
🔻 1H structure
All rebounds are basically passive repairs
Pushed up → Back to the original range
No continuous relay of bulls
So the market currently does not have a trend judgment, but is watching which side will explode first.
2. What changes have occurred in the clearing structure?
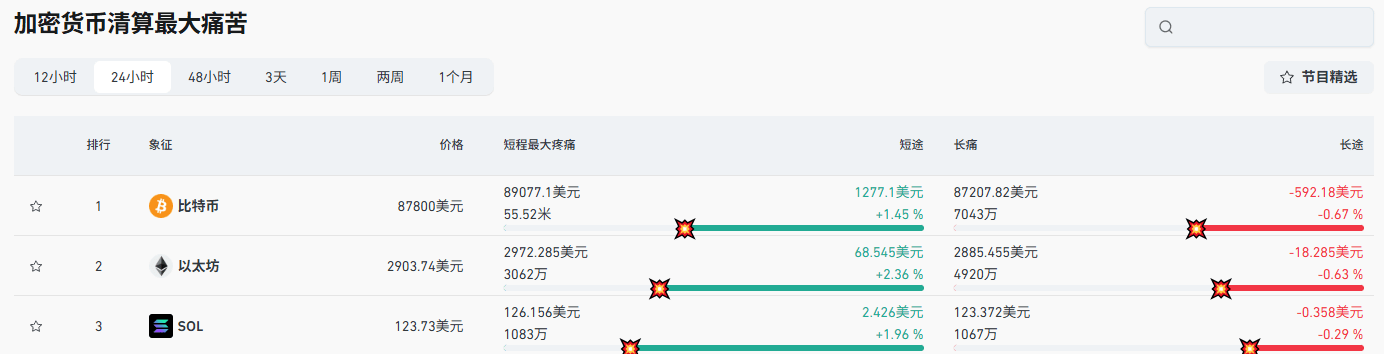
From the 12h / 24h / 48h three cycles, the structure is highly consistent.
🔴 Upper short maximum pain point
12h: ≈ 89,690
24h: ≈ 89,070
48h: ≈ 89,060
Distance from current price: +1.4% ~ +2.1%
Medium clearing volume
No strong overlapping dense area formed
Distribution slightly misaligned
Conclusion: There is clearing space above, but lacks the motivation of 'must pull now', more like if there is a rebound adjustment demand, it can be effortlessly harvested
🟢 Lower long maximum pain point (key)
12h: 87,060 – 87,200
24h: ≈ 87,200
48h: 86,460 – 86,500
Clearing volume significantly greater than shorts
Repeatedly appeared 70 million – 100 million level
Long cycle still completely exists
Conclusion: There are still many longs waiting to be forced to pay tuition below, if you have rich trading experience, you should be able to feel that in a weak structure, the clearing order usually prioritizes processing the 'heavy side'
3. Structure + Clearing synthesis judgment
Upper clearance is temptation, lower clearance is a task.
The market is currently not in a hurry to start an upward trend, more inclined to sideways consumption, or to continue downward clearing at the right moment
This is completely different from the characteristics of 'trend reversal early' market.
4. VWAP / EMA still stands on the short side
Today's VWAP signals remain clear:
Price always runs below VWAP
Every time it gets close, it gets pushed back
Note: The current rebound = repair fluctuation within the short cost zone, still not a bull-led market
To truly turn strong, it must be seen:
✅ Stand firm on VWAP
✅ Pullback does not break
✅ Transaction volume relay
Otherwise, it can only be viewed as a rebound.
5. Key structural location (execution level)
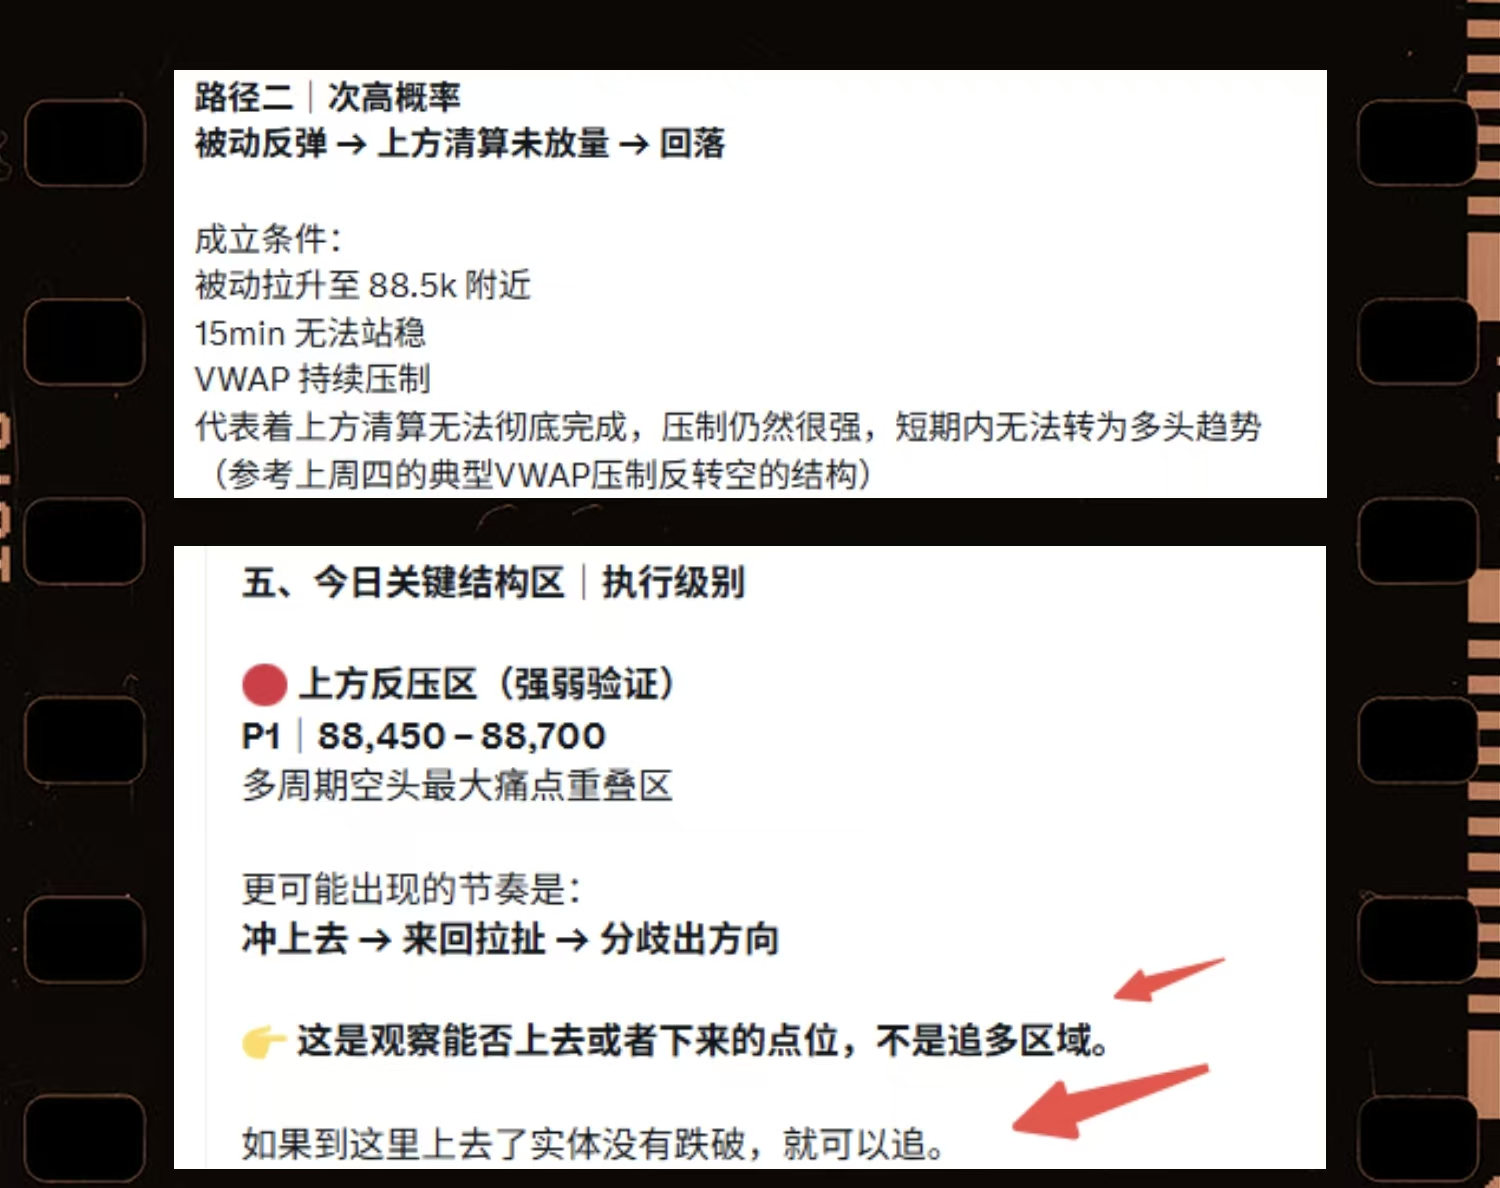
🔴 Upper pressure + Clearing observation area
89,050 – 89,700
Multi-cycle short pain point concentrated area
If touched, it's more likely to be a passive pull-up clear
Belongs to the temptation area and is not a trend initiation area
🟢 Lower risk area
S1: 87,060 – 87,200
Short cycle long maximum pain point
S2: 86,450 – 86,500
Medium to long-term clearing overlapping area
Once there is a real surge in volume, it can easily lead to accelerated downward pressure, chasing shorts can profit, and if S2 is offered, one can run.
6. Today's high probability path deduction
⭐ Path One (highest probability)
Range pulling consumption → Waiting for the lower clearing trigger
87.4k – 88.3k back and forth grind
Seems calm, risk is tilted down
Upper momentum insufficient
Lower position too heavy
VWAP continues to suppress
⭐ Path Two (second highest probability)
Passive rebound → Clearing part of shorts → Re-dip
Conditions:
Once again pulled to around 89k
15min entity still doesn't stand firm
Volume can't keep up
Belongs to temptation, same plot as yesterday.
⚠️ Path Three (low probability of turning strong)
Initial stage of bull trend, suitable for making pullback longs
Must meet simultaneously:
Entity firmly stands above 89.7k
Re-testing does not break
VWAP is moving up
Transaction volume increases
7. Currently, just need to keep an eye on
1️⃣ Is there bull strength actively pushing towards 89.5k+
2️⃣ Can VWAP be truly reclaimed?
3️⃣ 87.2k / 86.5k has there been a volume clearing
⚠️ Risk warning
The above content is based on structural and clearing behavior research type market analysis, does not constitute any investment advice.
Market changes rapidly, please make independent judgments and bear the risk (DYOR).$BTC

#2026比特币趋势 #比特币2026价格预测 #AI交易策略 #日内精准推演 #实盘交易