🚨 WARNING: THE MORTAL TRAP $BTC IS ABOUT TO BREAK THROUGH THE FLOOR AND THREATENS WITH A SWEEP OF LIQUIDATIONS 🚨
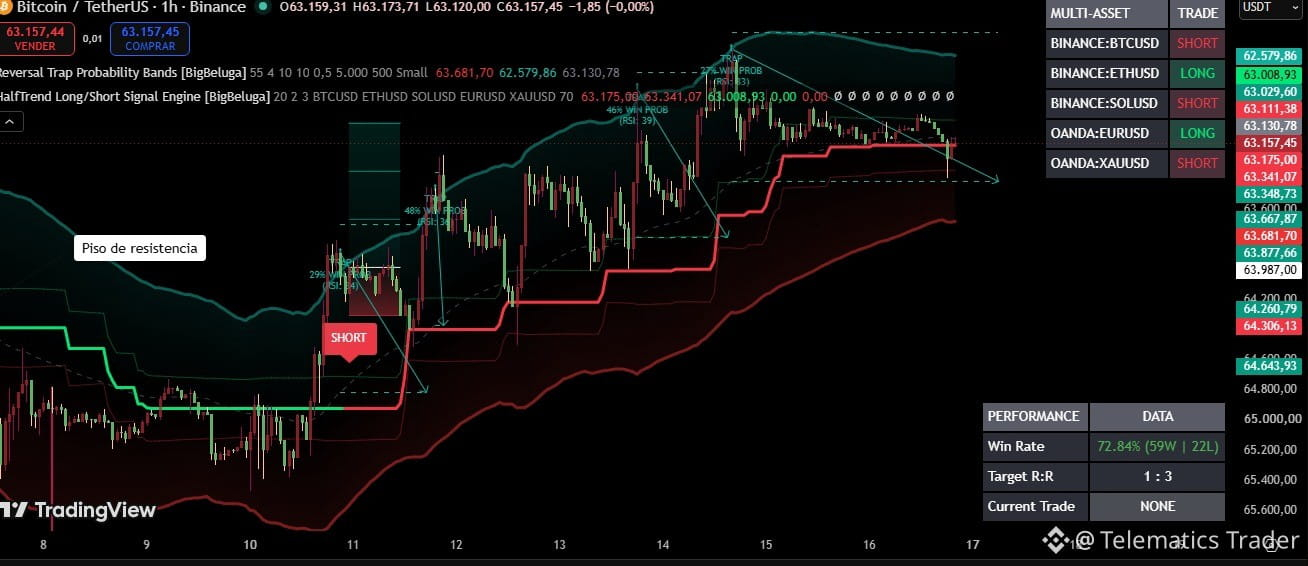
The 1-hour Bitcoin chart doesn’t lie: we’re witnessing the execution of a Bull Trap (bull trap) at the top end of the range. Buyers got confident with the $63,800, and the market is ready to punish excessive leverage.
💥 TECHNICAL IMPACT ANALYSIS:
📉 Live Trend Break: Bitcoin has just broken through the bullish trendline and is hanging over the abyss at $63,157 USDT.
🩸 The Red Floor Under Fire: The Reversal Trap Probability algorithm is flagging an area of imminent danger. The dynamic support between $63,008 and $62,579 is the last line of defense before the bears take full control.
⚠️ Active Sell Signal (SHORT): The multi-asset matrix shows BTC and SOL in a SHORT position, confirming that institutional capital flow is withdrawing the buy pressure.
☠️ THE MOST DANGEROUS SCENARIO:
If the price strongly breaks below the $62,579 USDT level, there will be no direct buffer until the week’s deeper liquidations. The bands indicate a fast collapse that could slaughter everyone who entered late in Long, chasing $64,000.
💡 STRATEGY: This is not the time to guess bottoms or trade emotionally. The indicator’s mathematical probability (72.84% Win Rate) favors caution. Breaking the floor means seeking liquidity below.
The 1-hour Bitcoin chart doesn’t lie: we’re witnessing the execution of a Bull Trap (bull trap) at the top end of the range. Buyers got confident with the $63,800, and the market is ready to punish excessive leverage.
💥 TECHNICAL IMPACT ANALYSIS:
📉 Live Trend Break: Bitcoin has just broken through the bullish trendline and is hanging over the abyss at $63,157 USDT.
🩸 The Red Floor Under Fire: The Reversal Trap Probability algorithm is flagging an area of imminent danger. The dynamic support between $63,008 and $62,579 is the last line of defense before the bears take full control.
⚠️ Active Sell Signal (SHORT): The multi-asset matrix shows BTC and SOL in a SHORT position, confirming that institutional capital flow is withdrawing the buy pressure.
☠️ THE MOST DANGEROUS SCENARIO:
If the price strongly breaks below the $62,579 USDT level, there will be no direct buffer until the week’s deeper liquidations. The bands indicate a fast collapse that could slaughter everyone who entered late in Long, chasing $64,000.
💡 STRATEGY: This is not the time to guess bottoms or trade emotionally. The indicator’s mathematical probability (72.84% Win Rate) favors caution. Breaking the floor means seeking liquidity below.