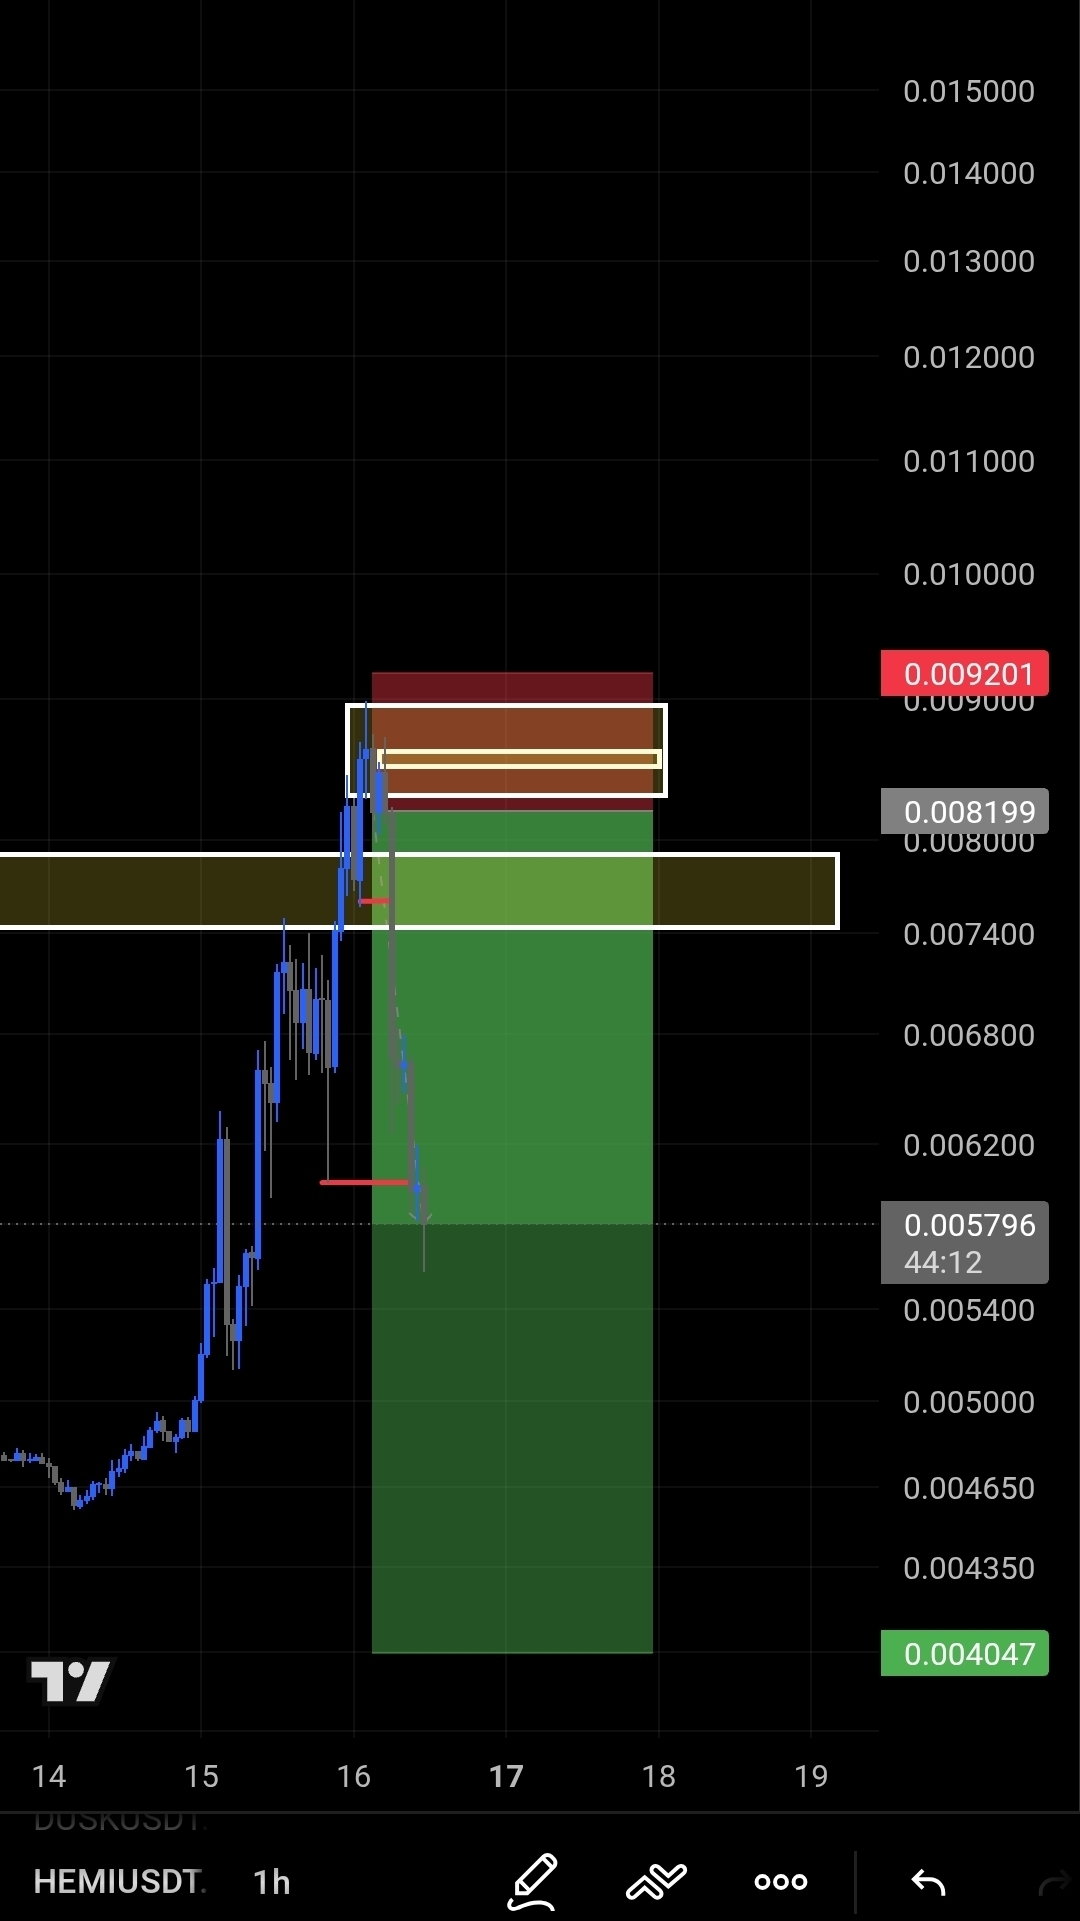
🚨Trade Setup Overview
* Asset Pair: HEMI / USDT (1-hour chart)
* Trade Direction: Short (Bearish / Sell Position)
* ♦️Entry Zone (White Box): \approx \$0.00820 - \$0.00890
*♦️ Stop Loss (Red Zone Top): \mathbf{\$0.009201} (Red line)
* ♦️Take Profit (Green Zone Bottom): \mathbf{\$0.004047} (Green line)
* Current Market Price (CMP): \mathbf{\$0.005796}
🌟Key Components of the Plan
1. Resistance & Entry Zone
* The price recently spiked upward to create a high around \$0.00900.
* The white outline box indicates a supply or order block resistance area where sellers rejected higher prices. The trade entered after price reached into this resistance region.
2. Invalidation & Risk Management (Stop Loss)
* Stop Loss at \$0.009201: Placed safely above the local high and resistance zone. If the price rises past this level, the setup becomes invalid, closing the trade to prevent major losses.
3. Target & Profit Management (Take Profit)
* Take Profit at \$0.004047: Placed near the previous swing low origin (around the September 14 base).
* Intermediate Support (Yellow Box): Placed around \$0.00740 - \$0.00780. This zone represents key structural support where traders often lock in partial profits or move their Stop Loss to break-even.
4. Risk-to-Reward Ratio (R:R)
* Risk per unit: \approx \$0.009201 - \$0.008200 = \$0.001001
* Potential reward per unit: \approx \$0.008200 - \$0.004047 = \$0.004153
* This yields an impressive Risk-to-Reward ratio of over 1:4, which is favorable for long-term consistency.
Current Status & Trade Execution
* The trade has already broken below the intermediate yellow support zone and reached a low near \$0.005796, capturing more than half of the target move.
* Recommended Next Actions:
* Protect Gains: Trailing your Stop Loss down to entry or into profit (e.g., above \$0.00740) to eliminate downside risk.