【Bitcoin Weekly “Four-Step Zoning” and Practical Trading Strategy for the Second Half of the Year】
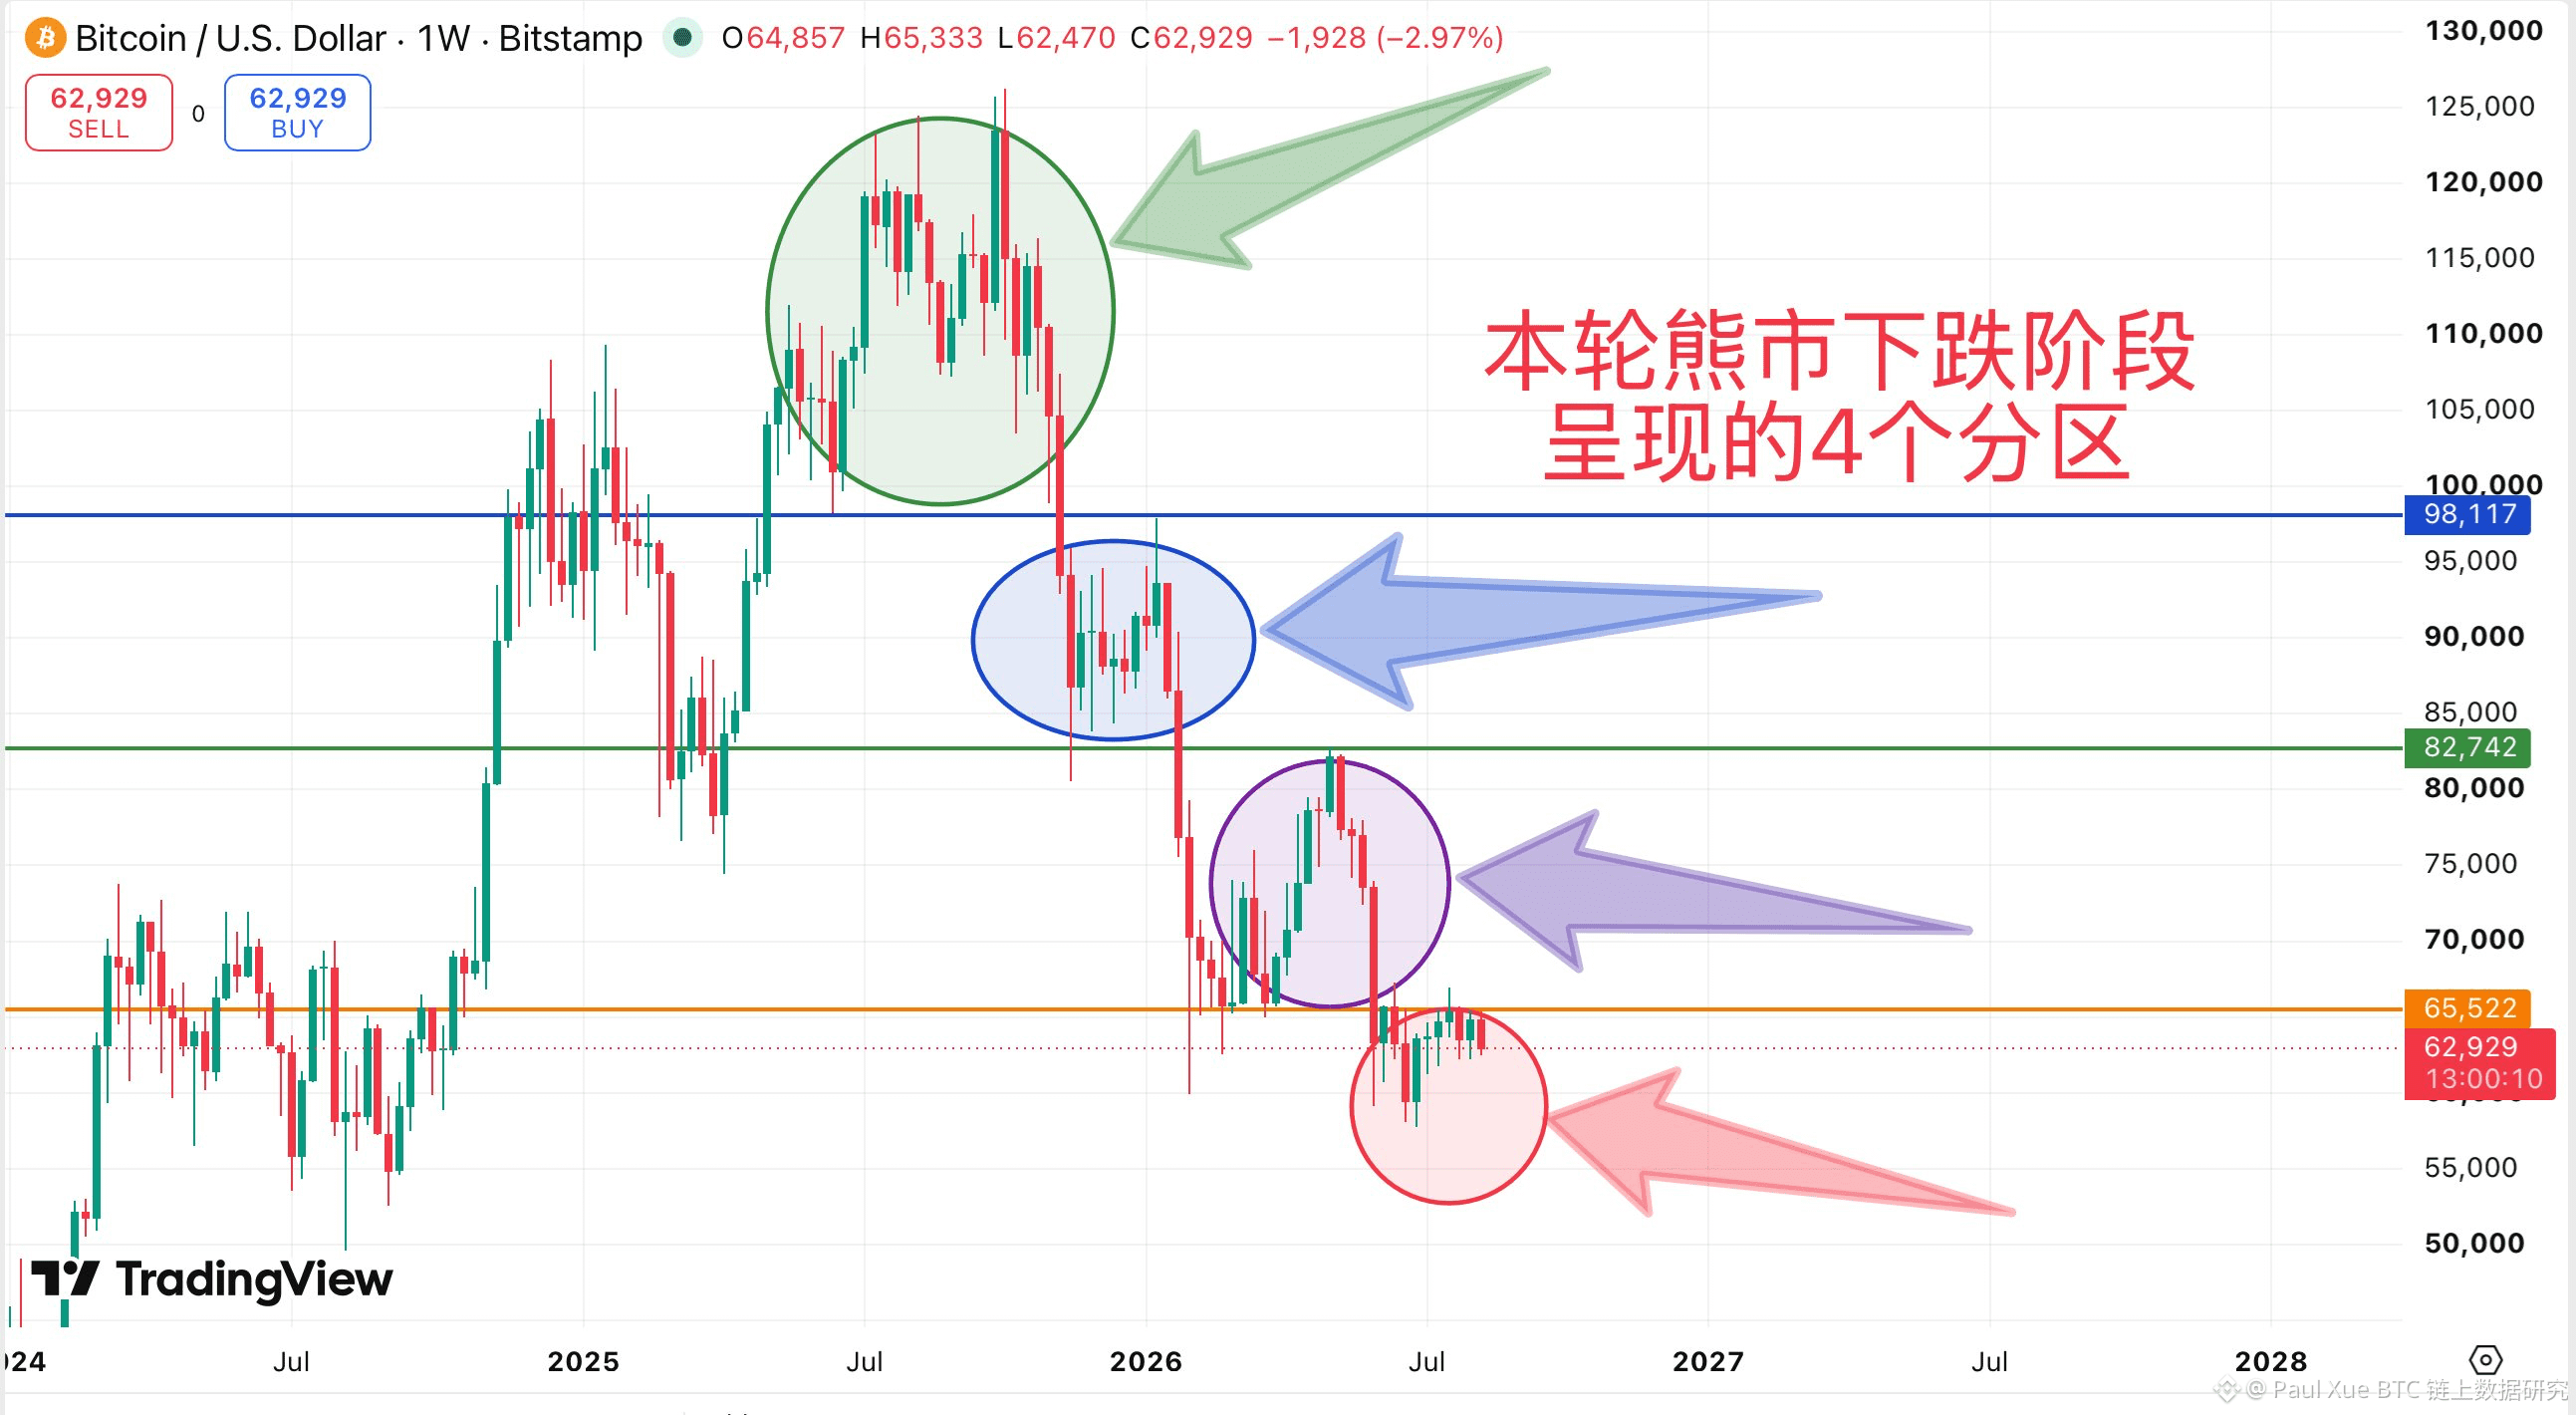
From the weekly chart’s走势 (price action), the current bear market decline shows an extremely strict “four-level step zoning” pattern, along with support/resistance flip characteristics:
Four clear zones:
Green zone (98.1k top distribution)
➡️ Blue zone (82.7k–98.1k interim resistance)
➡️ Purple zone (65.5k–82.7k breakdown and acceleration)
➡️
Red zone (below 65.5k · current bottom probing).
Structural rule: Each time the market breaks down through a prior support platform, that level immediately turns into a strong resistance that cannot be crossed, causing the weekly candlestick body’s weight to step down progressively, with the boundaries between each pair of zones remaining distinct.
Second-half price projection and practical strategy:
Currently, the weekly candlestick bodies remain suppressed below 65.5k. If they still fail to reclaim the level for a long time, after the sideways move exhausts long-side buying pressure, the second half is likely to break down and search for a bottom, carving out the true cycle-level bottom.
Left-side strategy (refuse to catch blindly): Below 65.5k, do not easily go all-in with heavy positions. Maintain a strategic wait-and-see stance; patiently wait for the market to break down through the current platform, trigger liquidity panic to “dig out the golden pit,” and then scale in to buy the dip in batches.
Right-side strategy (confirm bull/bear transition): Only when the weekly candlestick bodies break out with increased volume and hold above 65.5k, can it be interpreted as breaking the stepwise downtrend structure. At that point, it can serve as a decisive confirmation signal for “bear to bull,” and you can follow the right-side trade promptly.
In the second half, do you lean toward staying in cash and waiting for the deep pit to break down, or do you plan to DCA in batches at the current level? Feel free to discuss your positioning strategy in the comments.
From the weekly chart’s走势 (price action), the current bear market decline shows an extremely strict “four-level step zoning” pattern, along with support/resistance flip characteristics:
Four clear zones:
Green zone (98.1k top distribution)
➡️ Blue zone (82.7k–98.1k interim resistance)
➡️ Purple zone (65.5k–82.7k breakdown and acceleration)
➡️
Red zone (below 65.5k · current bottom probing).
Structural rule: Each time the market breaks down through a prior support platform, that level immediately turns into a strong resistance that cannot be crossed, causing the weekly candlestick body’s weight to step down progressively, with the boundaries between each pair of zones remaining distinct.
Second-half price projection and practical strategy:
Currently, the weekly candlestick bodies remain suppressed below 65.5k. If they still fail to reclaim the level for a long time, after the sideways move exhausts long-side buying pressure, the second half is likely to break down and search for a bottom, carving out the true cycle-level bottom.
Left-side strategy (refuse to catch blindly): Below 65.5k, do not easily go all-in with heavy positions. Maintain a strategic wait-and-see stance; patiently wait for the market to break down through the current platform, trigger liquidity panic to “dig out the golden pit,” and then scale in to buy the dip in batches.
Right-side strategy (confirm bull/bear transition): Only when the weekly candlestick bodies break out with increased volume and hold above 65.5k, can it be interpreted as breaking the stepwise downtrend structure. At that point, it can serve as a decisive confirmation signal for “bear to bull,” and you can follow the right-side trade promptly.
In the second half, do you lean toward staying in cash and waiting for the deep pit to break down, or do you plan to DCA in batches at the current level? Feel free to discuss your positioning strategy in the comments.