

Why do you always lose money?
Your entry time or take-profit/stop-loss is always swept out.
It might be that you’ve misidentified your key levels.
Today, I’ll share a few technical tips and personal insights
Hope this helps everyone 😀
When many people first start looking at candlestick charts, they fall into an easy-to-trap pit:
If it drops here, just draw a resistance level.
If it rises here, just draw a support level.
The more lines you draw, the more the entire candlestick chart looks like a spider web.
But the real important issue is not:
“Where should this line be drawn?”
But the real question is:
“Why is this position worth becoming a key level?”
Earlier, I was the same way
Draw lines everywhere
But I don’t know which one is useful.
Through learning and practice
Summarized a few small experiences
When I look for support and resistance myself now, I usually focus on these four conditions.
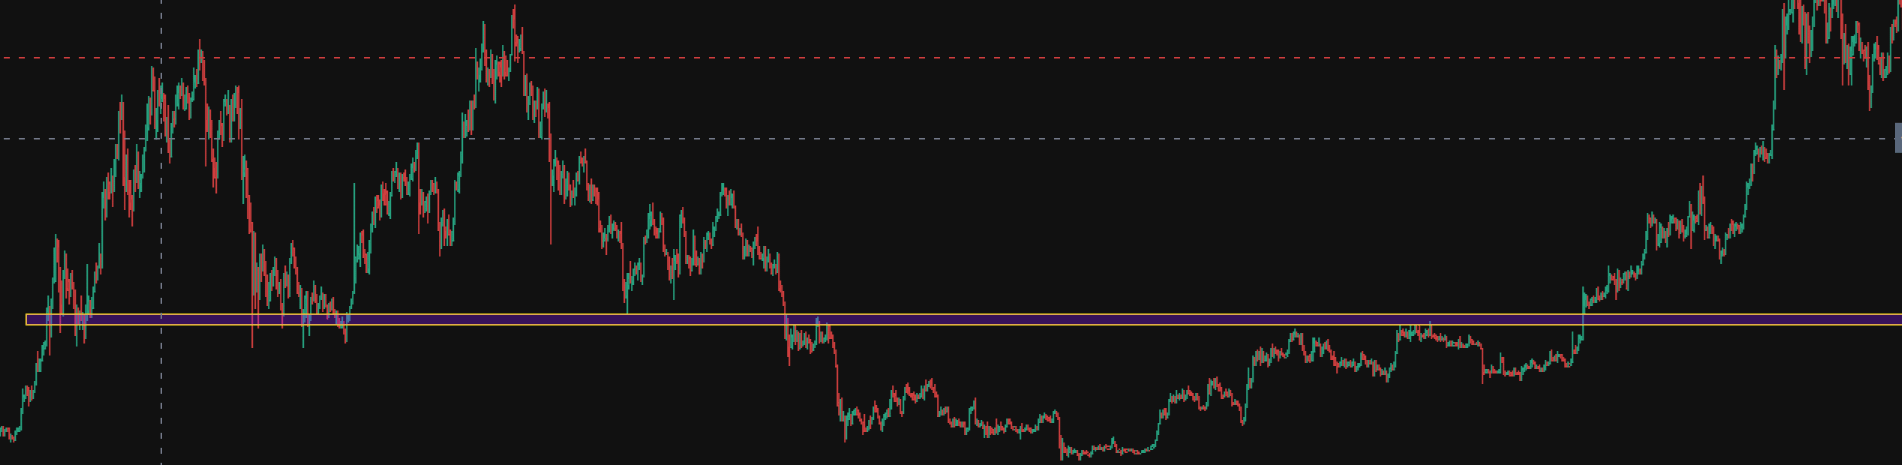
1. The more times it’s been contacted, the more worth paying attention to.
If a level only shows a reaction once, its reference value is actually limited.
But if the price keeps returning to the same zone:
The first time it reaches here, a rebound happens;
The second time it comes back, and a reaction appears again;
After some time, it gets tested again, and changes still occur here.
So this area is worth focusing on.
Because with prices repeatedly coming back, it already shows
Here, multiple long/short battles have happened repeatedly.
Of course, it’s not as simple as thinking “the more times it’s touched, the stronger it must be”—instead, repeated testing makes this price zone more valuable to observe.
2. Has there been a strong reaction?
In simple terms, it’s
After the price comes here, what exactly happens?
If it only taps once and then slowly moves away, the significance might not be that big.
But if after the price comes into a certain zone, there’s a clear fast rally, a fast drop, or even directly changes the original trading rhythm.
Then this level is worth paying attention to.
Because that means
Here, there was a relatively obvious shift in force.
In plain terms—
It’s not just “touched”—it’s “touched and then fought it out.”**
This kind of level is usually more worth putting into your observation range than a dull and ordinary price zone.
3. Can you see it at a glance?
This point is actually very easy to overlook.
I personally prefer to look for this kind of:
No magnifying glass needed, no researching for half a day—just open the candlestick chart and you’ll find the answer.
Because a truly obvious key zone usually doesn’t require overly complicated explanation.
You can see it—
Others can see it too.
The more market participants see it, the more likely this zone becomes a focus for everyone.
So sometimes, when finding a key level, you actually shouldn’t make it too complicated.
If it takes you half a day of research just to prove it’s important, then it probably isn’t that important in the first place.
4. Has there been a “support → resistance” shift?
This is the kind of level I like to重点 observe the most.
Let’s take a simple example:
The price is coming to around 100.
The first time, 100 held, and the price rose.
Later the price dropped again, and around 100 it held up again.
But on some occasion, the price finally broke below 100.
Next, the price rebounds and comes back to around 100 again.
But this time—
It won’t go up.
The original support becomes resistance.
That is:
Support → breaks down → resistance
A level that has acted as both a “floor” and a “ceiling” is usually more worth paying attention to than a price zone that only reacted once.
There’s another very important one:
I usually don’t use just one line as the key level
It’s not one single point—it’s a range.
A relatively small range
This can lead to a higher chance of successful order placement
These 4 points hopefully will help everyone.
It doesn’t mean all 4 points have to be satisfied.
Rather, the more conditions you meet, the more accurate the level
But one more thing to emphasize here:
Key levels aren’t magical prices.
When the price reaches here, it doesn’t mean it must rise, and it doesn’t mean it must fall.
It’s more like a—
“Important battles happened here in the past, so it’s worth focusing on from here on.”
For me, drawing support and resistance lines is never about predicting exactly how the market will move.
It’s for helping myself
Find the important price zones in the market
Only if you get the right position, you’ll get twice the result with half the effort.
If you’re interested, later I can keep sharing some details I personally focus on when watching the market.