$HEMI
#scalping_trading
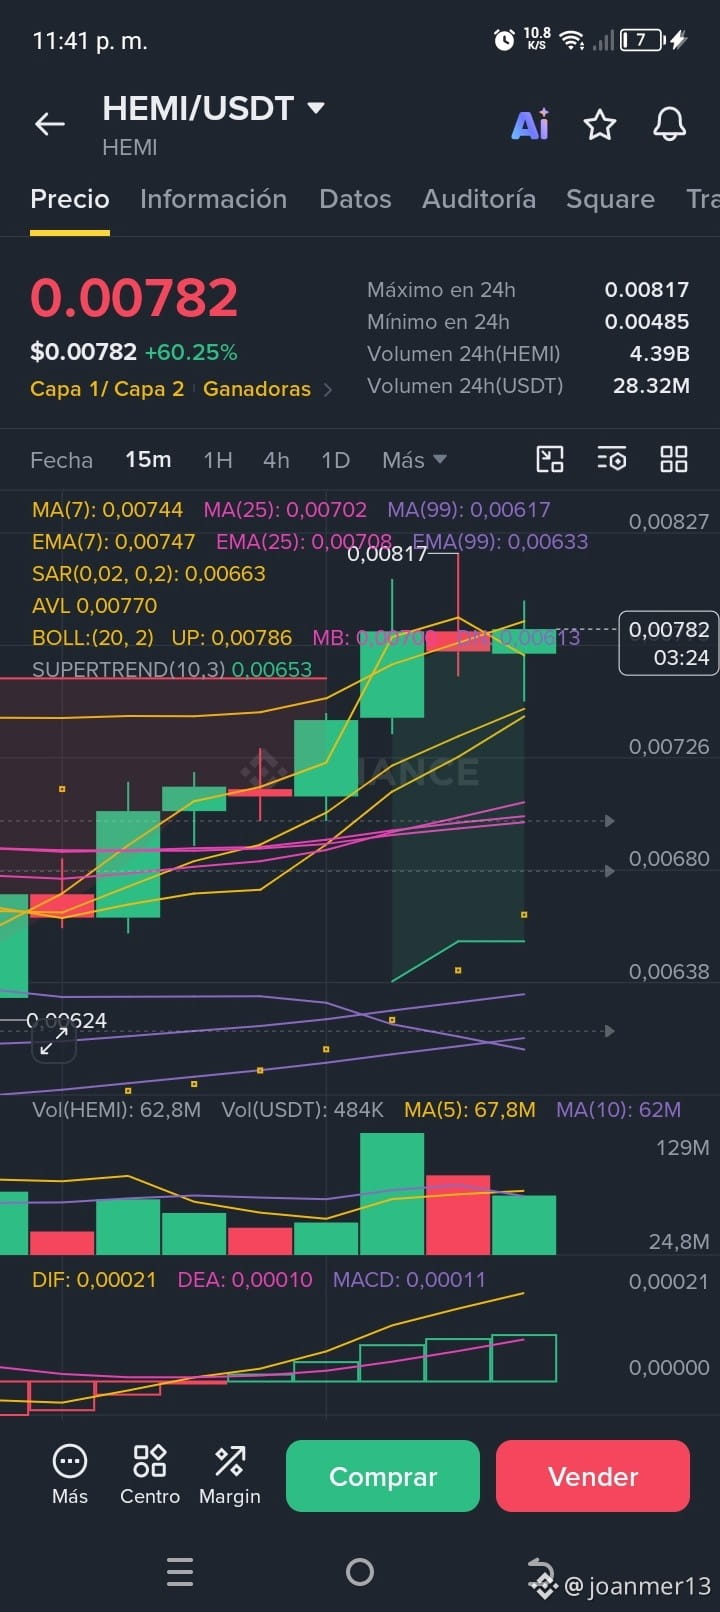
The chart of HEMI/USDT (15m) shows an ongoing uptrend (+60.25%), but the price is currently sticking to the upper Bollinger band (0.00786) and near the recent resistance (0.00817). Entering a Long (buy) at this exact point entails a high risk of immediate correction.
#scalping_trading
The chart of HEMI/USDT (15m) shows an ongoing uptrend (+60.25%), but the price is currently sticking to the upper Bollinger band (0.00786) and near the recent resistance (0.00817). Entering a Long (buy) at this exact point entails a high risk of immediate correction.