Attention with silver $XAG
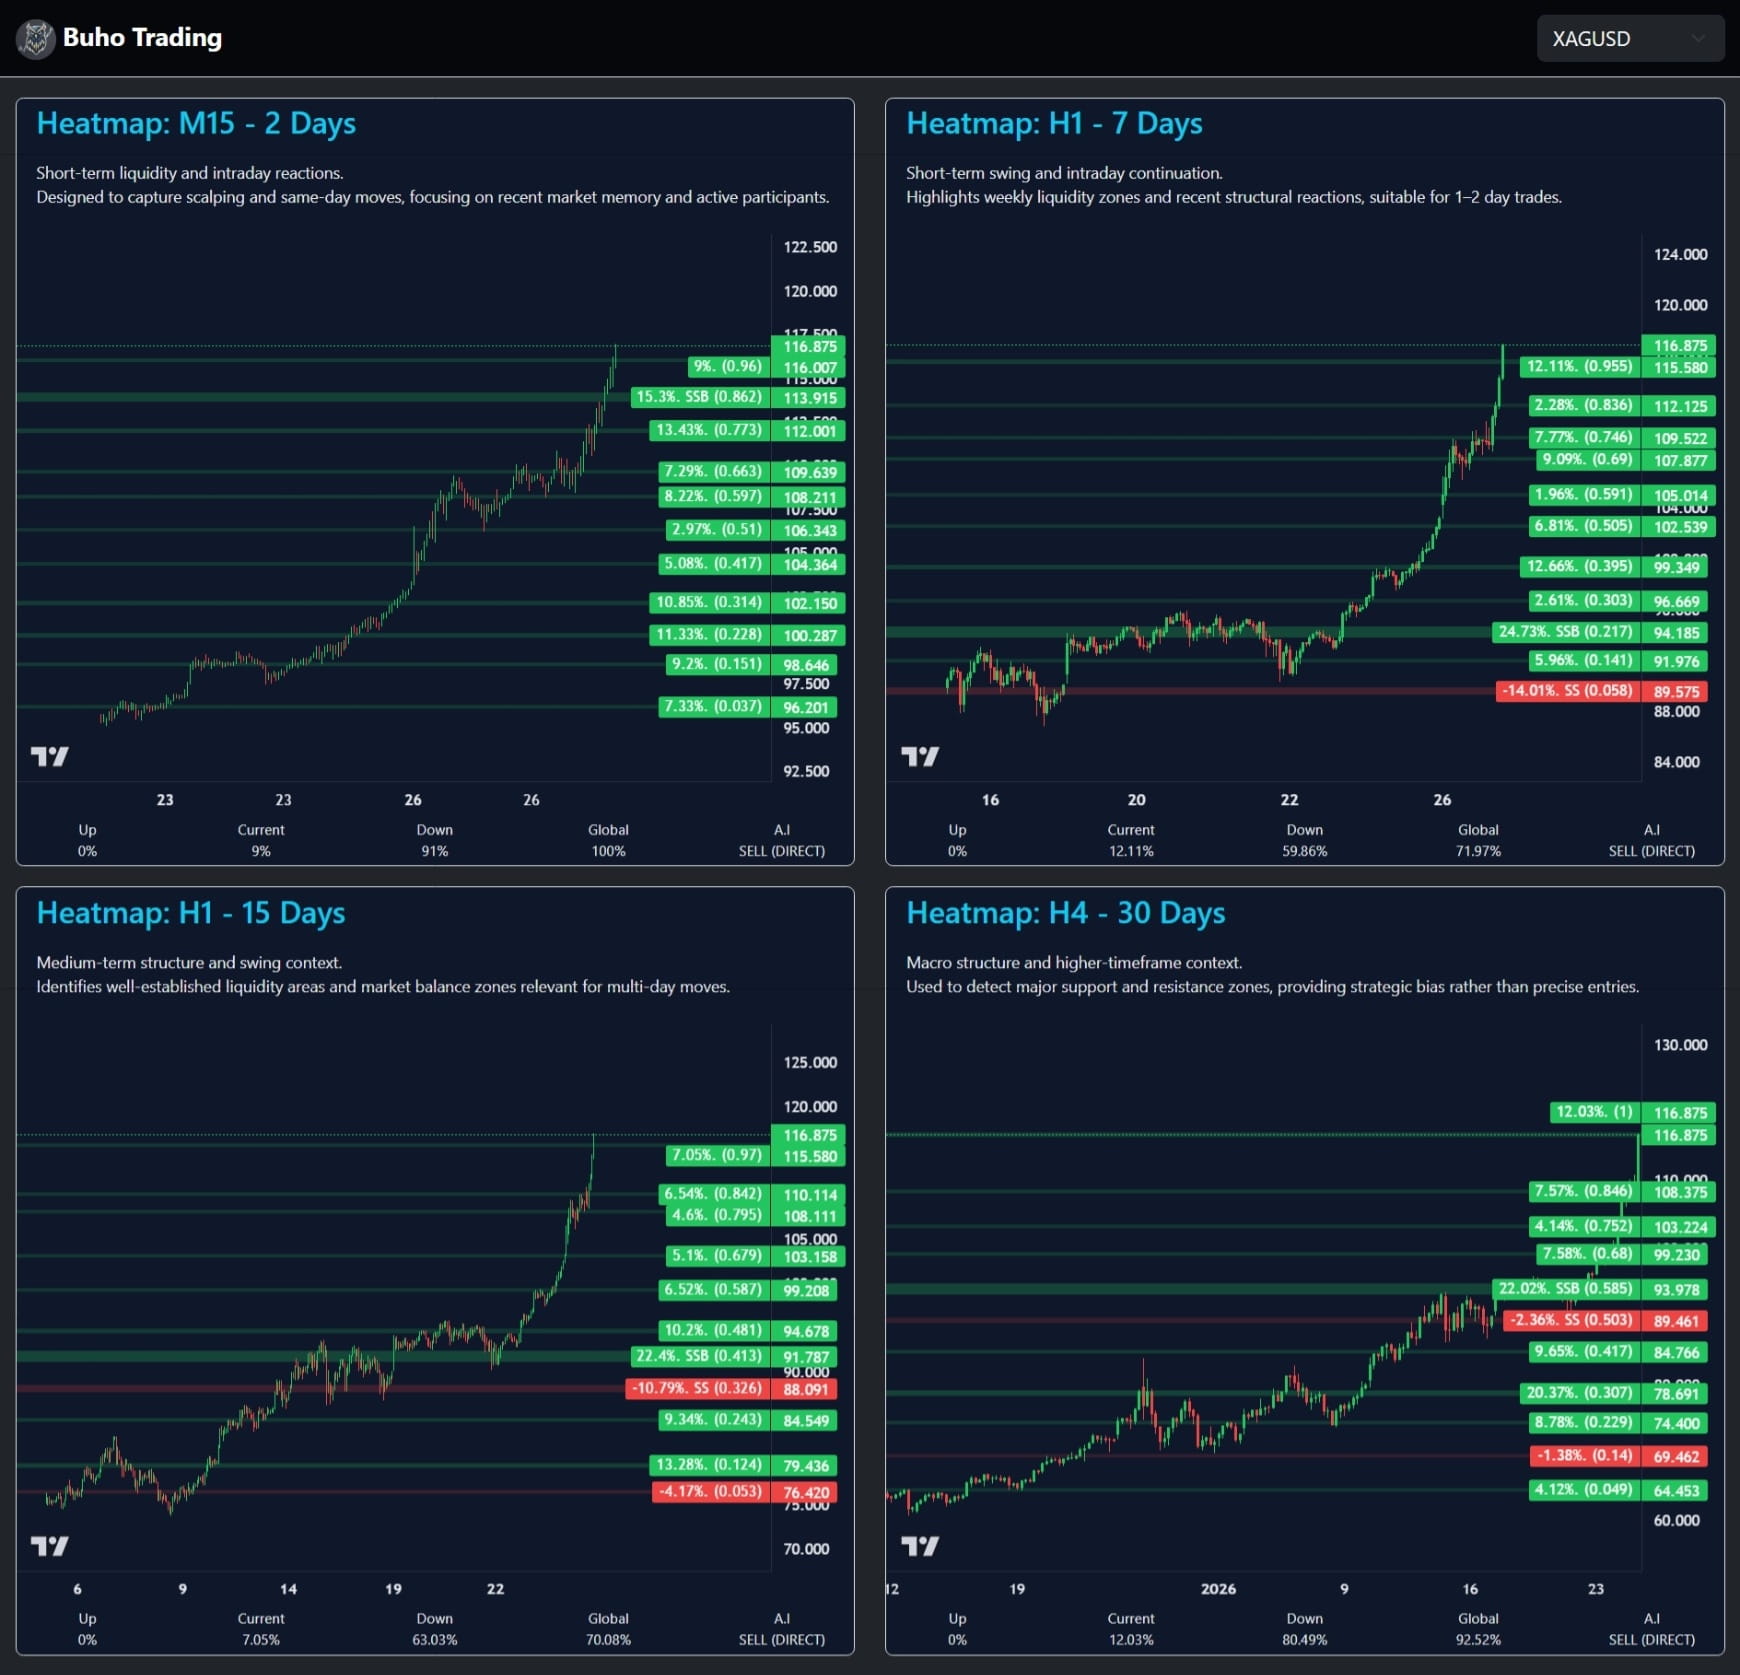
Although the main trend continues to be bullish, the price is currently in a relevant overextension zone, suggesting that a correction or pause may be necessary before attempting new highs.
Analysis by time frames according to the heat map:
2 days:
The buying power reaches 100%, with the highest concentration located at the top of the range, a clear signal of short-term overbought.
7 days:
A buying concentration of 71.9% is observed, maintaining the bullish bias, although with less immediate continuity margin.
15 days:
The buying pressure is at 70.08%, reinforcing the idea of an extended movement.
30 days:
The map shows a strong buying concentration of 92.52%, confirming the underlying trend, but also the high level of demand of the current movement.
Conclusion:
Silver maintains a solid bullish structure on larger timeframes, but the level of overextension observed in the short and medium term suggests caution. It will be key to observe how the price reacts to possible corrections before evaluating new continuations upward.
Disclaimer:
This content is for informational and educational purposes only and does not constitute financial advice or a recommendation to invest. Every trade involves risk; conduct your own analysis before making decisions.