


From the long position trend on Bitfinex (Big B Network), analyze the mid-term price trend of Bitcoin. From the chart, it can be observed that the Bitcoin trend is actually inversely proportional to the position trend. For example, in April 2025, when large holders began to reduce their holdings, it continued until early June, corresponding to a Bitcoin price of around 70000, and then it rose to 126000. Then they started to increase their holdings, which lasted until around December 20, with the corresponding Bitcoin price dropping from 126000 to around 80000. Recently, they began to reduce their holdings again, corresponding to a price rebound to around 97000. Currently, they have started to increase their holdings again, while the Bitcoin price has dropped to around 86000, with no signs of reducing holdings yet. Based solely on this current indicator, the mid-term Bitcoin trend has not stabilized in its decline. There's a point to note: this indicator mainly assesses the mid-term trend, particularly for short-term contracts, and may not provide an accurate reference. Those interested can check this indicator for backtesting.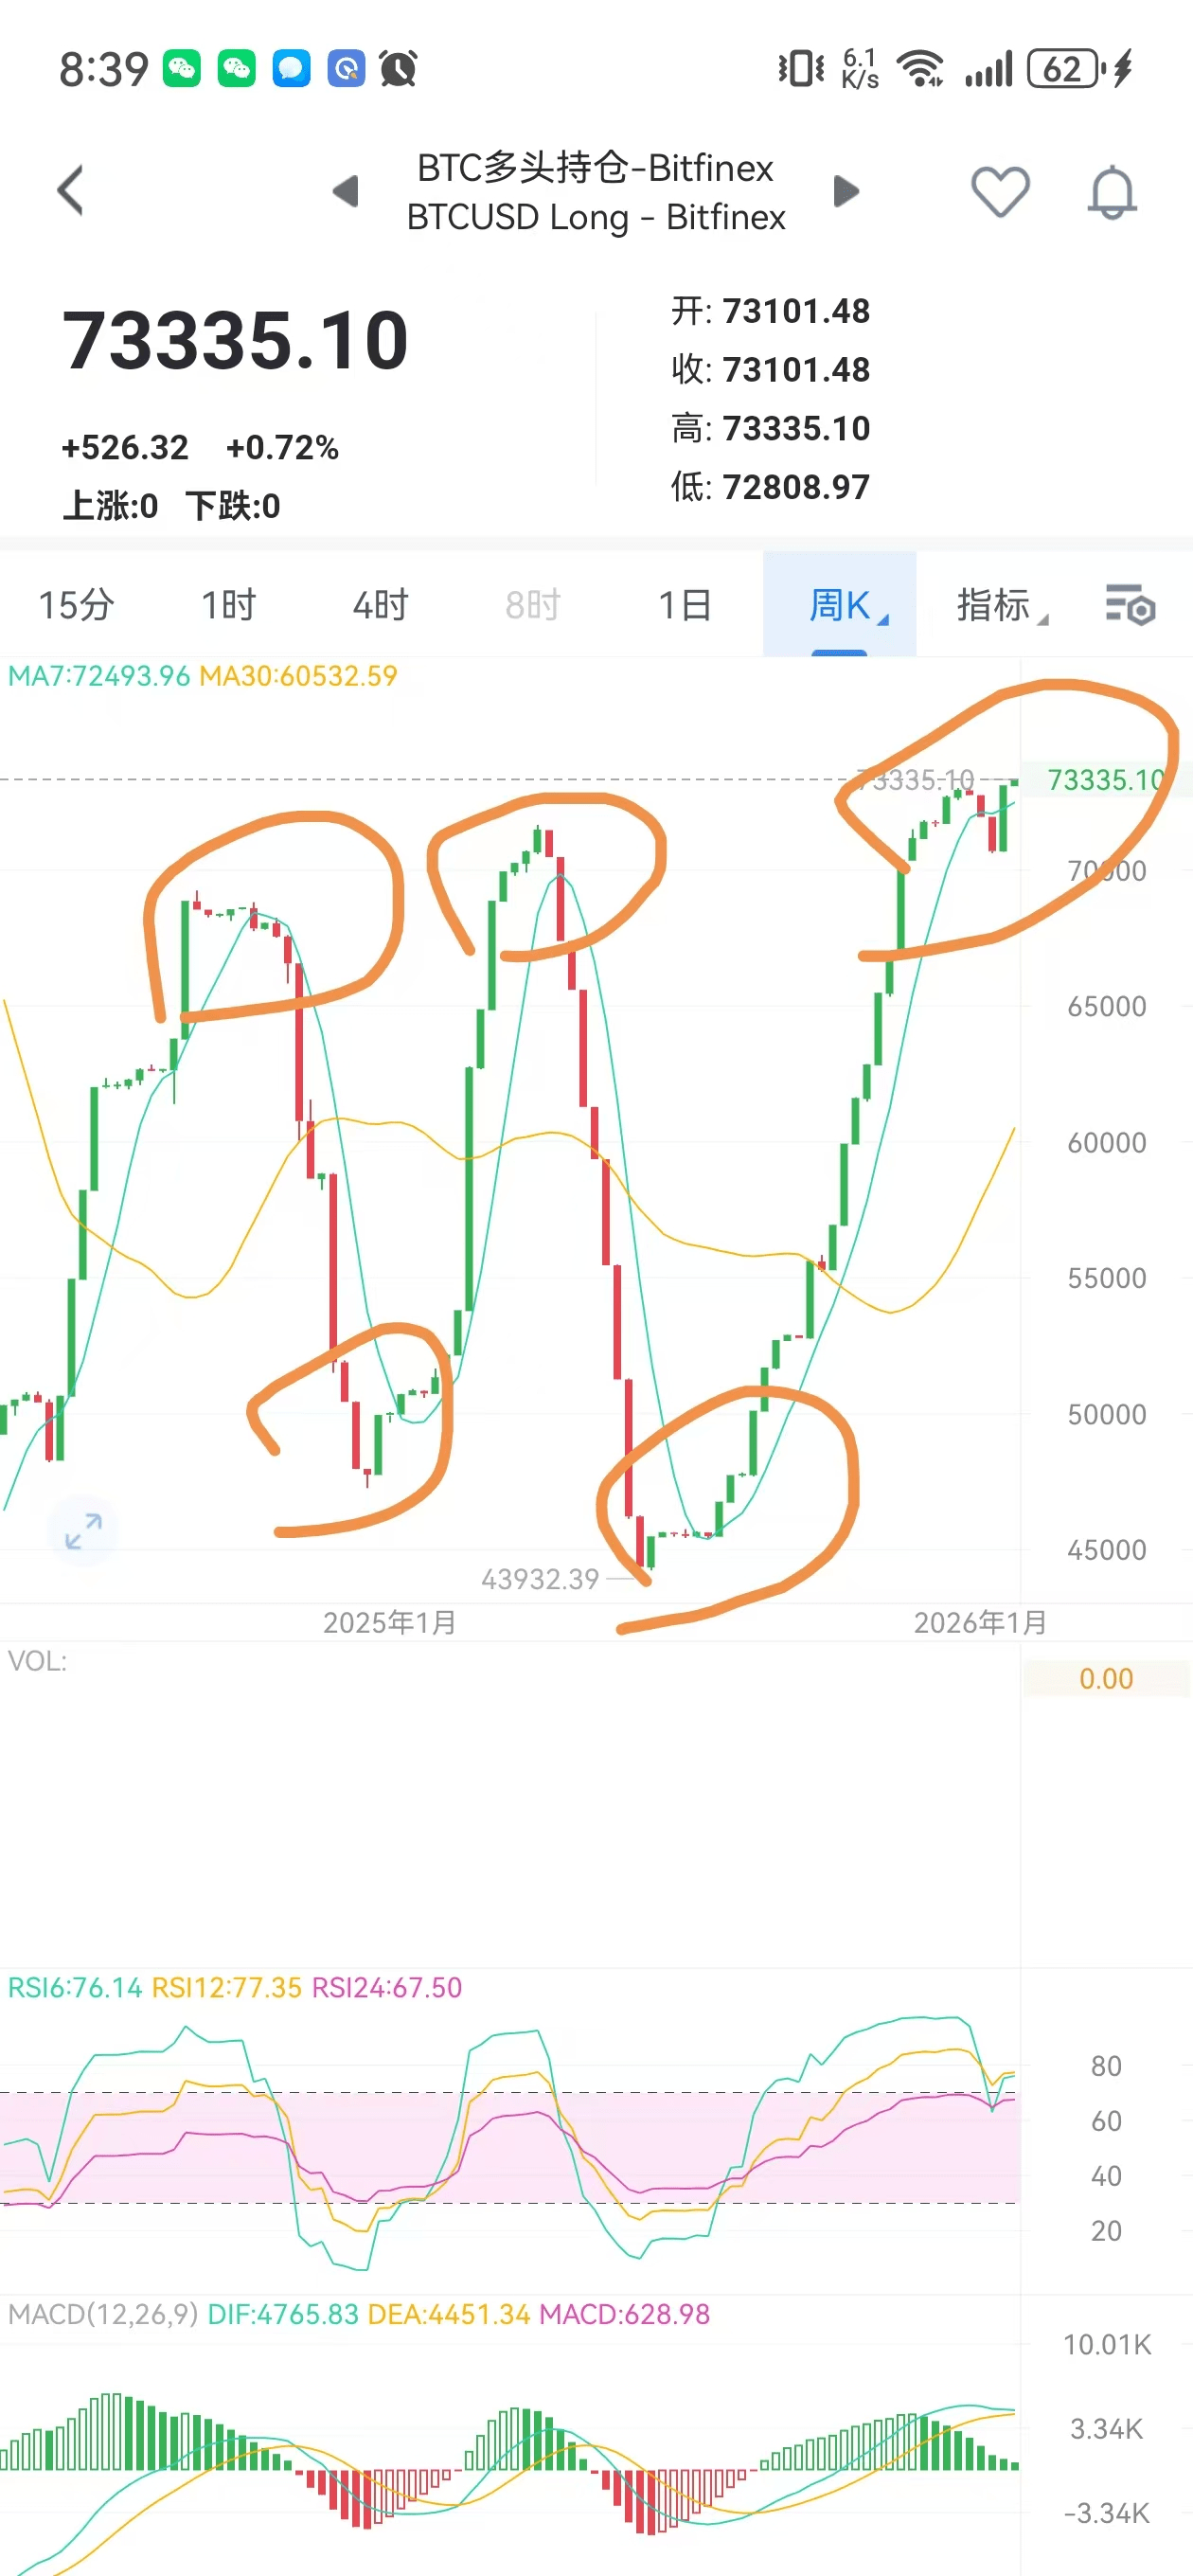
If you feel this is helpful, please give it a thumbs up 🌹🌹🌹, and I will share a method for short-term trend analysis again below if there’s an opportunity. Note: All indicators are just for reference, there is no 100% accuracy, these are just to improve our trading success rate, ultimately it still relies on personal ability and position management.