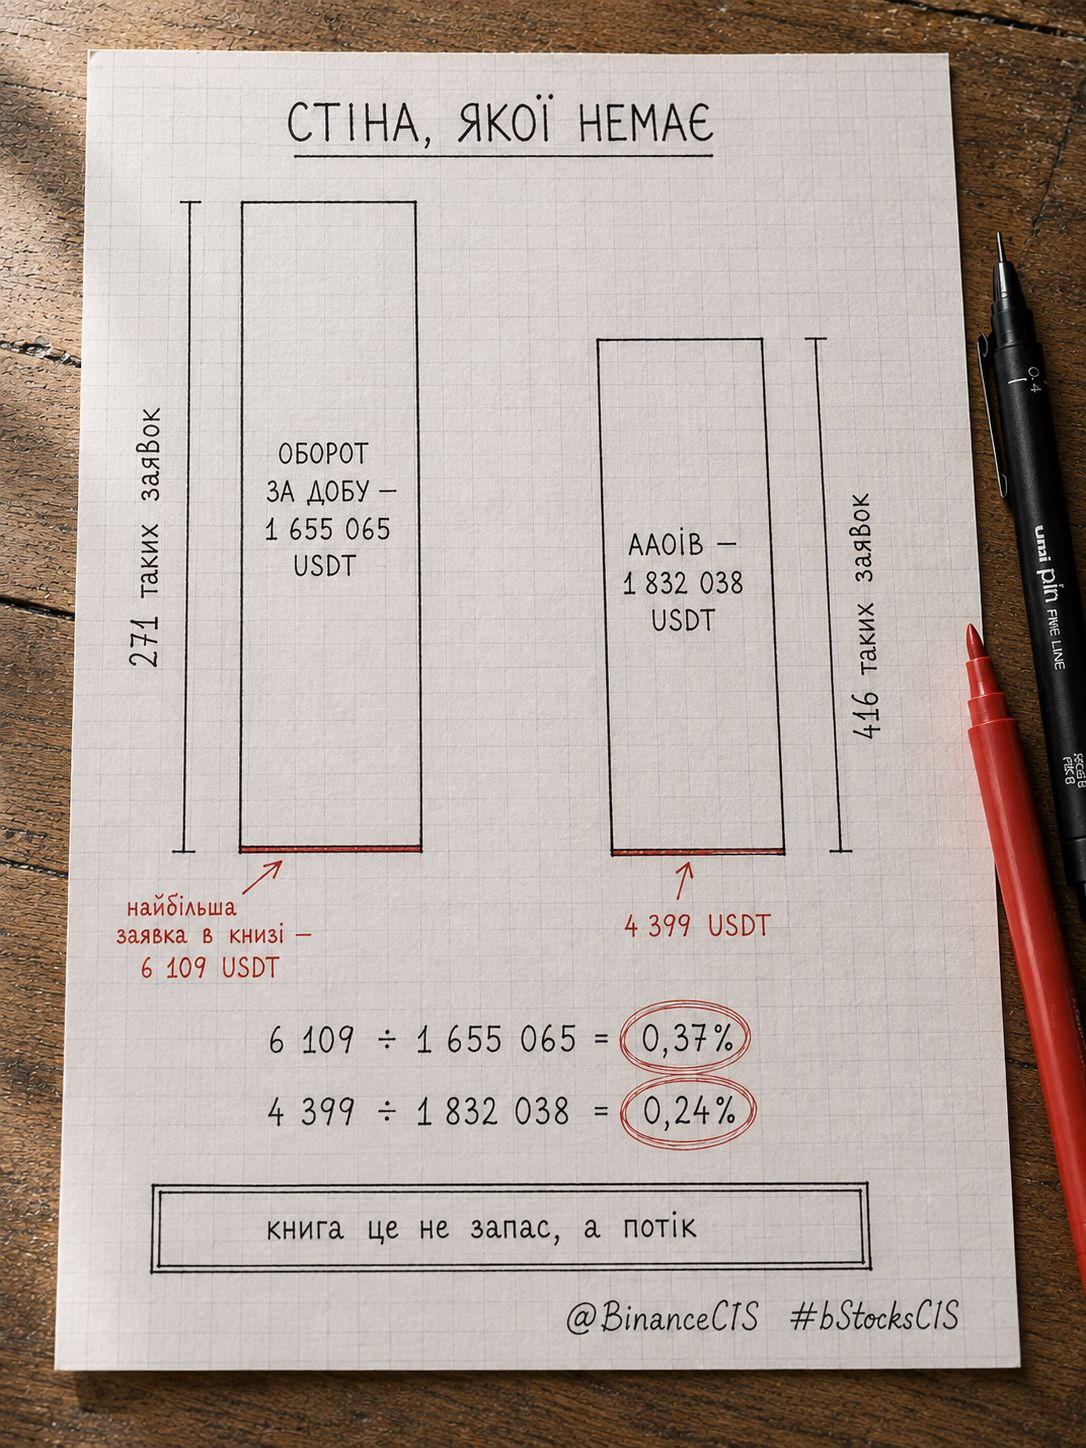
The largest order in the book $TSLAB is 0.37% of the daily trading volume. I checked another ticker and it turned out to be even less.
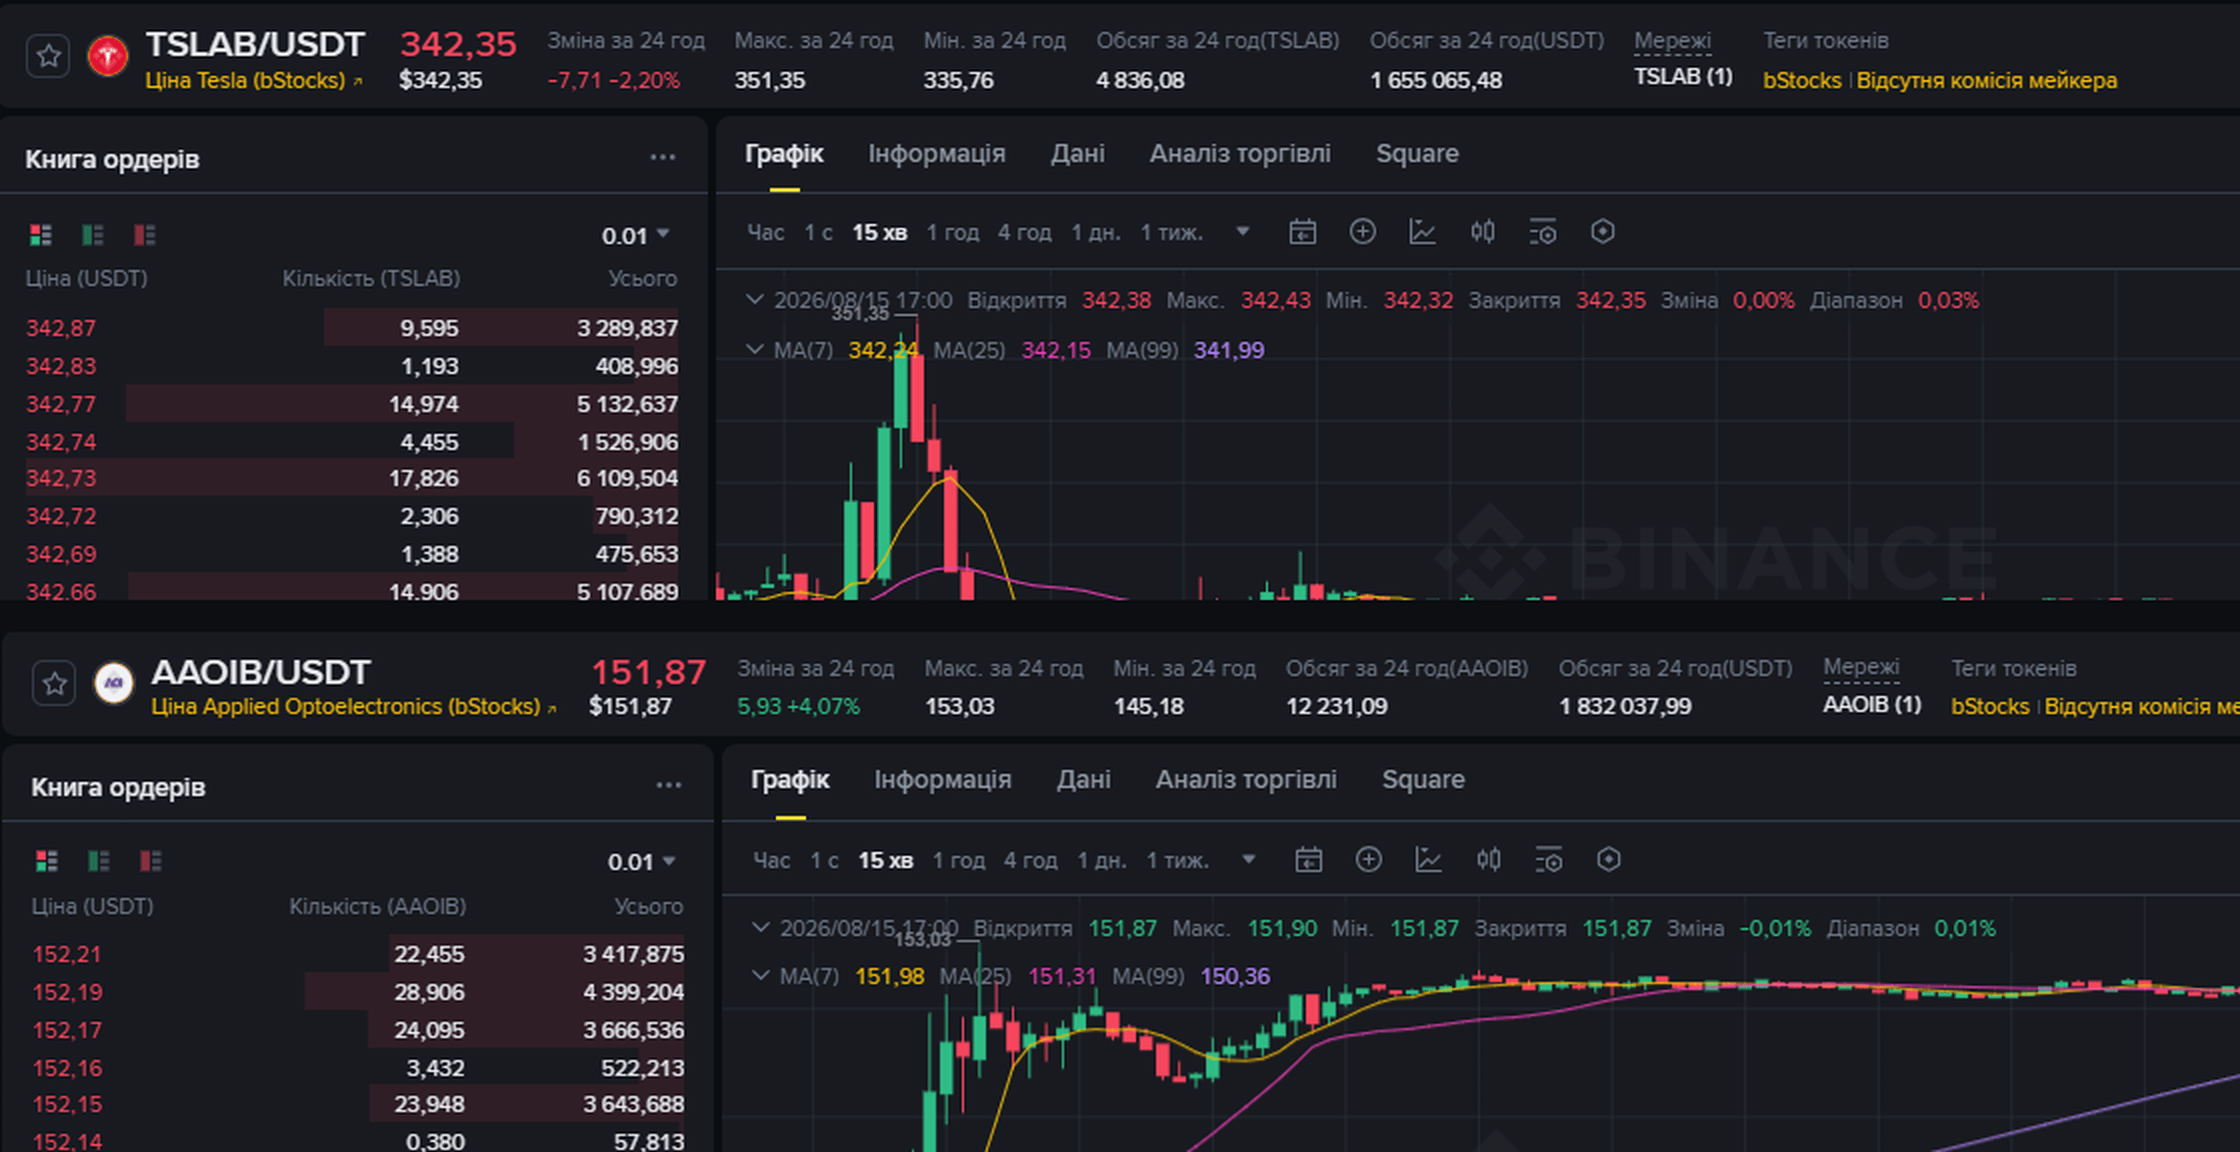
I looked at the order book at 17:00 and calculated how much the thing I’m seeing actually weighs.
The largest visible selling level:
17.826 TSLAB at 342.73 = 6 109 USDT
Daily pair volume from the header: 1 655 065 USDT
6 109 ÷ 1 655 065 = 0.37%
Otherwise: 1 655 065 ÷ 6 109 = 271
To reach the daily turnover, such a level would need to fill and disappear 271 times.
Checked at $AAOIB at the same moment:
28.906 at 152.19 = 4 399 USDT
Daily volume: 1 832 038 USDT
4 399 ÷ 1 832 038 = 0.24%
That’s 416 fills.
Two different tickers, different character of the day—same order of magnitude.
Here’s where I was wrong. I was looking at the book and thought I was seeing liquidity. In reality, I’m seeing a slice with thickness of a fraction of a percent.
Practically. A level that looks like a wall disappears in minutes, and often not because it was bought up, but because it was canceled/removed. Building an entry on the assumption that a large order will hold the price is a mistake.
Limitations: I counted only the visible part of the book; deeper there are still more levels. One slice, at 17:00.
The book shows the moment. Volume shows the day.
@BinanceCIS #bStocksCIS
I looked at the order book at 17:00 and calculated how much the thing I’m seeing actually weighs.
The largest visible selling level:
17.826 TSLAB at 342.73 = 6 109 USDT
Daily pair volume from the header: 1 655 065 USDT
6 109 ÷ 1 655 065 = 0.37%
Otherwise: 1 655 065 ÷ 6 109 = 271
To reach the daily turnover, such a level would need to fill and disappear 271 times.
Checked at $AAOIB at the same moment:
28.906 at 152.19 = 4 399 USDT
Daily volume: 1 832 038 USDT
4 399 ÷ 1 832 038 = 0.24%
That’s 416 fills.
Two different tickers, different character of the day—same order of magnitude.
Here’s where I was wrong. I was looking at the book and thought I was seeing liquidity. In reality, I’m seeing a slice with thickness of a fraction of a percent.
Practically. A level that looks like a wall disappears in minutes, and often not because it was bought up, but because it was canceled/removed. Building an entry on the assumption that a large order will hold the price is a mistake.
Limitations: I counted only the visible part of the book; deeper there are still more levels. One slice, at 17:00.
The book shows the moment. Volume shows the day.
@BinanceCIS #bStocksCIS