BTC dominance
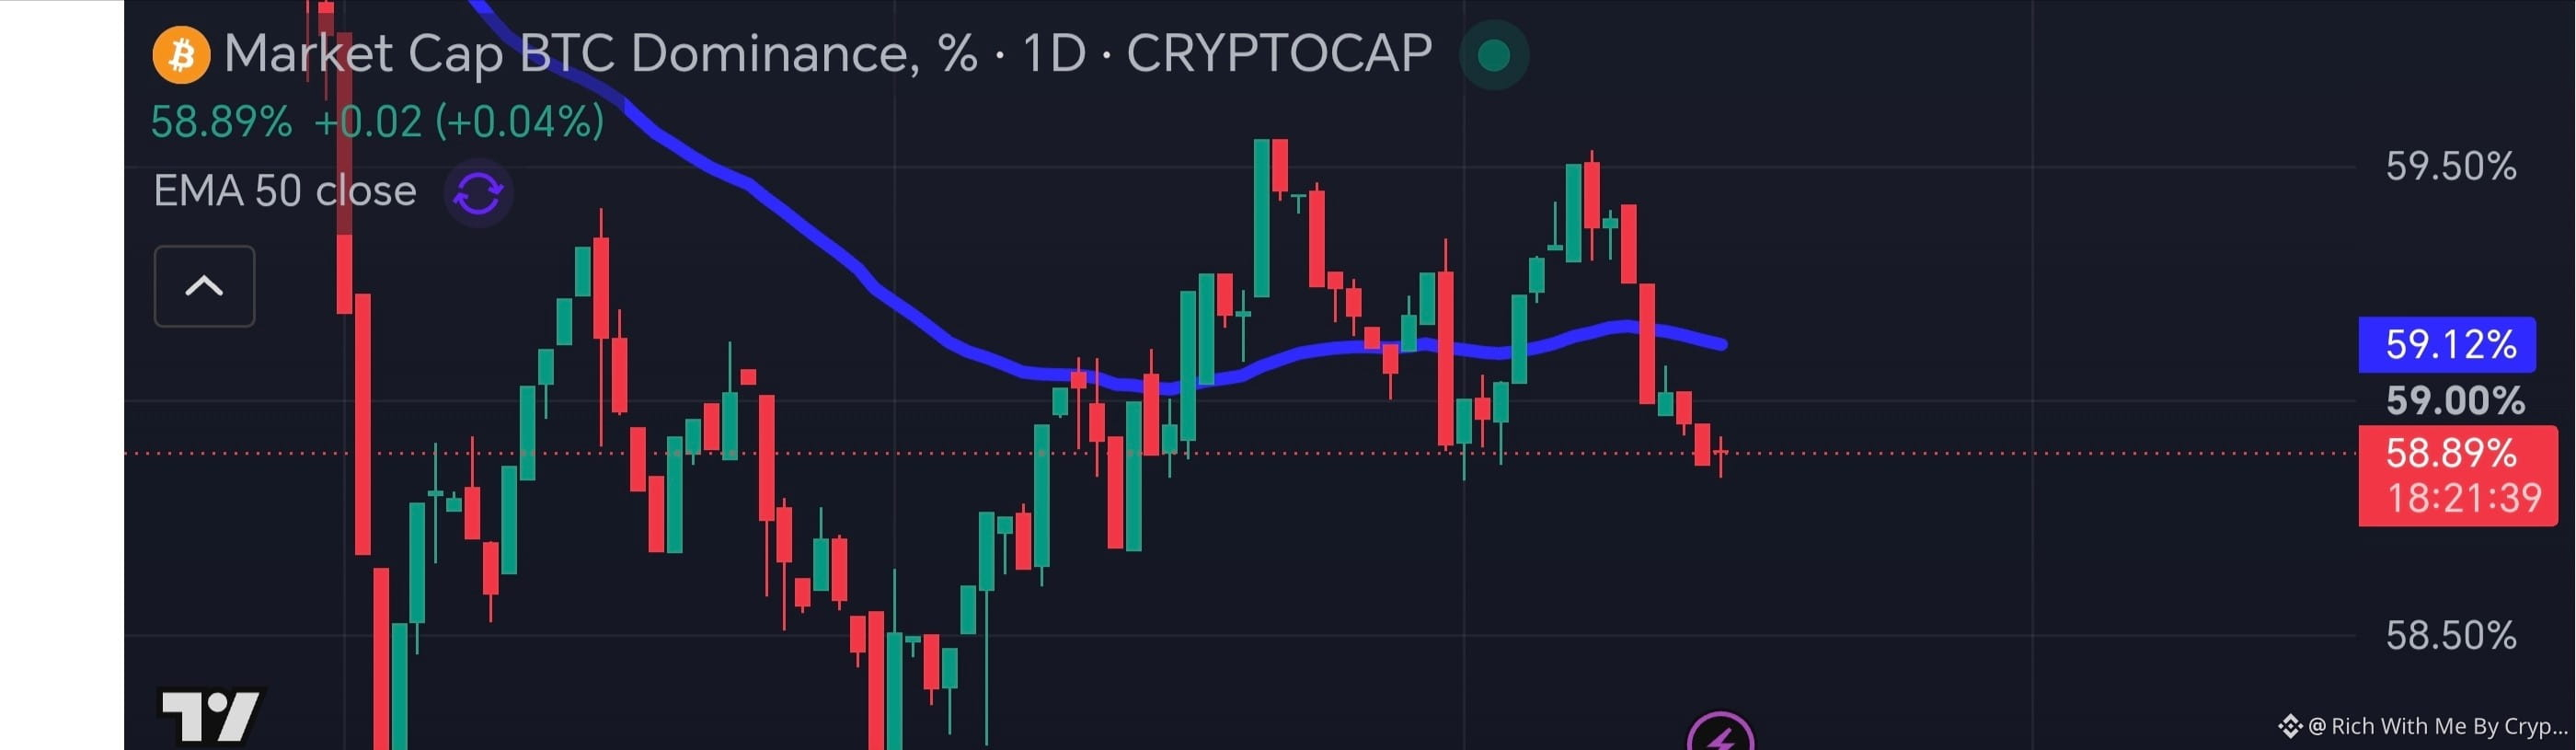
Yes. This is the BTC Dominance (BTC.D) 1D chart, currently around 58.89%, with the 50-day EMA around 59.12%.
📊 Technical analysis
1. Short-term trend: Bearish
BTC.D was rejected strongly from the 59.45–59.55% area.
It has formed a sequence of lower highs recently.
Current price 58.89% is below the 50 EMA (59.12%), which is a bearish short-term signal.
Several consecutive red candles show selling pressure.
2. Important support
58.85–58.90%: immediate support — price is testing this now.
58.50%: stronger support.
58.20–58.30%: next major support if 58.50 breaks.
3. Important resistance
59.00%: immediate psychological resistance.
59.12%: 50 EMA — very important.
59.40–59.55%: major resistance/rejection zone.
🔥 What this means for altcoins
If BTC.D breaks below 58.85% and closes a daily candle below it, I would consider that increasingly positive for altcoins. A move toward 58.50% → 58.20% could create stronger altcoin momentum, assuming BTC itself remains stable.
However, if BTC.D reclaims 59.12% and holds above the 50 EMA, the recent bearish structure could weaken, and altcoins may face renewed pressure.
My current bias
BTC.D: 🟥 Bearish / weakening
Key level to watch today:
58.85%
🔻 Below 58.85 → 58.50 → 58.20%
🔺 Above 59.12 → 59.40 → 59.55%
So right now, the chart is slightly favorable for an altcoin relief move, but I would want to see a confirmed daily break below 58.85% before calling it a stronger altseason signal.
Yes. This is the BTC Dominance (BTC.D) 1D chart, currently around 58.89%, with the 50-day EMA around 59.12%.
📊 Technical analysis
1. Short-term trend: Bearish
BTC.D was rejected strongly from the 59.45–59.55% area.
It has formed a sequence of lower highs recently.
Current price 58.89% is below the 50 EMA (59.12%), which is a bearish short-term signal.
Several consecutive red candles show selling pressure.
2. Important support
58.85–58.90%: immediate support — price is testing this now.
58.50%: stronger support.
58.20–58.30%: next major support if 58.50 breaks.
3. Important resistance
59.00%: immediate psychological resistance.
59.12%: 50 EMA — very important.
59.40–59.55%: major resistance/rejection zone.
🔥 What this means for altcoins
If BTC.D breaks below 58.85% and closes a daily candle below it, I would consider that increasingly positive for altcoins. A move toward 58.50% → 58.20% could create stronger altcoin momentum, assuming BTC itself remains stable.
However, if BTC.D reclaims 59.12% and holds above the 50 EMA, the recent bearish structure could weaken, and altcoins may face renewed pressure.
My current bias
BTC.D: 🟥 Bearish / weakening
Key level to watch today:
58.85%
🔻 Below 58.85 → 58.50 → 58.20%
🔺 Above 59.12 → 59.40 → 59.55%
So right now, the chart is slightly favorable for an altcoin relief move, but I would want to see a confirmed daily break below 58.85% before calling it a stronger altseason signal.