


Sober Options Studio × Derive.XYZ Joint Production

Written by Sober Options Studio Analyst Jenna @Jenna_w5
I. Macroscopic Overview: The TACO Storm, the Japanese Bond Crash, and the Misalignment of Risk Aversion Logic
Standing at the closing moment of January 2026, the global financial markets are undergoing an extremely rare, multidimensional liquidity test. Unlike past pricing logic driven by single inflation or recession data, the current macro environment is exhibiting unprecedented fragility. This uncertainty does not stem from the traditional cycle of change, but rather from a 'paradigm shift' triggered by the weaponization of geopolitical tools and capital.
1.1 The TACO Storm Reappears: When Tariffs Become Geopolitical 'Ransom'
Recently, the most breath-holding event for the market has been the sovereign turmoil in Greenland. The Trump administration has distorted tariffs, originally used for trade regulation, into a 'ransom' for territorial sovereignty. This move has completely shattered the boundaries of the international order since World War II, and Deutsche Bank has issued a severe warning: the situation is rapidly evolving into 'Capital Weaponization.'
As the largest overseas 'creditor' of the United States, Europe holds about $8 trillion in asset chips. Faced with this extreme coercion linking sovereignty and trade, Europe is beginning to reassess its defensive boundaries. If the EU activates the Anti-Coercion Instrument (ACI), by cutting off capital flows and implementing structural countermeasures against American investments, it will directly hit the fiscal and growth models that the United States has long relied on external deficits to maintain. This game has moved beyond the realm of commodity trade, extending into the deep field of global investment rules and capital pricing.
Although Trump subsequently initiated the so-called 'TACO' model (i.e., forcefully reversing market sell-offs through soothing rhetoric) via social media, attempting to enter a fragile emotional recovery phase, this 'quasi-policy' volatility based on individual will has made it difficult for global risk premiums to return to normal.
1.2 Japanese Bond Market Collapse: The 'Truss Moment' of Global Pricing Anchors
On the other side of the Pacific, one of the world's largest bond markets—the Japanese government bond market—is experiencing its darkest hour in history. The extreme easing policy insisted upon by Prime Minister Kishi Sanae clashes head-on with the recent dismal bond auction data, triggering a collective liquidation referred to as Japan's version of the 'Truss Moment.'
This turbulence is not limited to Japan. As a 'ballast' for global capital flows, the uncontrollable yield of Japanese government bonds has caused severe fluctuations in global pricing anchors. The Bank of Japan's 'hawkish inaction' and subsequent vague discussions on Yield Curve Control (YCC) did not calm emotions but instead triggered drastic fluctuations in forex trading desks regarding yen intervention.
1.3 Double Kill of Stocks and Bonds: The 'Death Trap' of the 60/40 Investment Portfolio and the Necessity of Options
In traditional asset allocation logic, the 60/40 investment portfolio (60% stocks + 40% bonds) has been regarded as the bible for robust returns across cycles. Its core logic lies in the long-standing negative correlation between stocks and bonds: when the stock market declines due to recession, bonds typically rise due to inflows of safe-haven funds and expectations of rate cuts, thereby smoothing the account curve.
However, the market environment at the beginning of 2026 has shattered this illusion. Under the concerns of capital weaponization triggered by the 'Greenland Storm,' global investors are facing a combination of rebounding inflation expectations and geopolitical risks. This extreme macro backdrop has led to a breakdown of stock-bond correlation—rapidly shifting from negative to positive correlation. When inflation pressures force interest rates to stay high, stock valuations are hit hard, while Japan's 'Truss moment' has caused fixed income assets to lose their safe-haven anchor functionality.
This 'synchronized sell-off' has led to the largest single-day loss for accounts since last October. Investors painfully realize that passive holding in the face of extreme volatility is no longer a virtue, but a disaster.
In the current macro environment, viewing long put options as an 'expensive insurance' is short-sighted. In fact, accepting small, planned hedging costs and leveraging the convexity of options to lock in downside risk has shifted from an 'optional' choice to the 'only solution' for survival. This essentially involves using controllable Theta (time value) decay to replace uncontrollable systemic risk.
1.4 Testing the quality of 'digital gold': Why hasn't BTC risen?
Faced with the traditional 'double kill of stocks and bonds,' funds should theoretically flow into decentralized 'digital gold' BTC. However, the reality is that gold has risen for three consecutive weeks, silver has surged, while BTC has been caught in a turbulent consolidation under pressure. This performance 'dislocation' hides a profound fracture in market pricing logic.
We summarize this phenomenon as the 'two-stage theory' of hedging narrative:
Phase One: Panic Hedging. At the initial stage of risk outbreak (such as the current phase in January 2026), the global capital's first choice remains traditional physical assets backed by thousands of years of credit and high liquidity. Gold and silver absorbed the first wave of defensive capital flowing from equity and debt markets. In contrast, although BTC is known as 'digital gold,' it still possesses strong risk-on attributes in the risk assessment models of large institutions. In extreme panic, the first reaction of institutions is de-risking, i.e., reducing positions in high-volatility assets, making BTC the first to suffer liquidity pressure.
Phase Two: Concerns Over Currency Depreciation and Liquidity Expansion. Historical experience shows that BTC's breakout usually occurs after a 'halftime break' in risk aversion. When the market realizes that the traditional sovereign credit system must once again implement expansionary policies in response to crises, or when local geopolitical games evolve into long-term credit default risks, BTC's anti-inflation and sovereign immunity properties will truly shine.
The current market in January 2026 is evidently still in the first phase. Funds are seeking refuge in the most traditional and stable hedging tools. BTC's price action often requires weeks or even months of lag; it is waiting for risk sentiment to shift from 'pure panic' to 'deep skepticism toward the credit system.' During this transition period, investors tend to reduce risk exposure, which also explains why BTC still behaves like a volatile risk asset in the current macro environment.
2. In-depth analysis of BTC & ETH options market data
Combining chart data from Amberdata & Derive.XYZ, this week's volatility evolution clearly records the market's psychological path from 'regular fluctuations' to 'extreme defense.' The resonance of the Greenland geopolitical storm and Japan's 'Truss moment' directly rewrote the pricing structure of the options market.
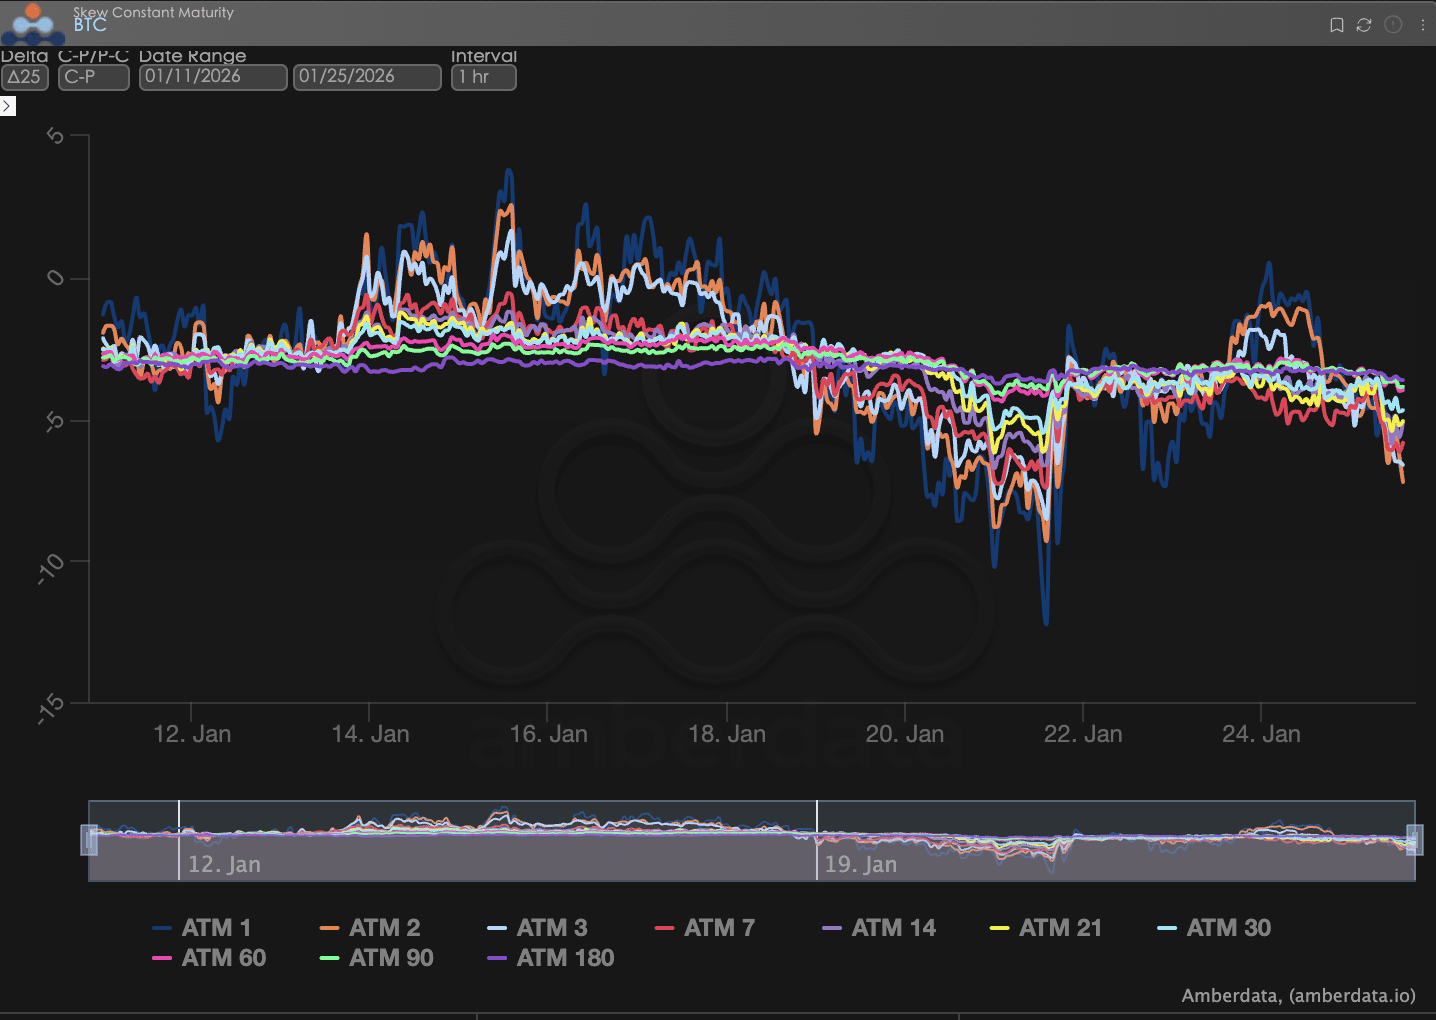
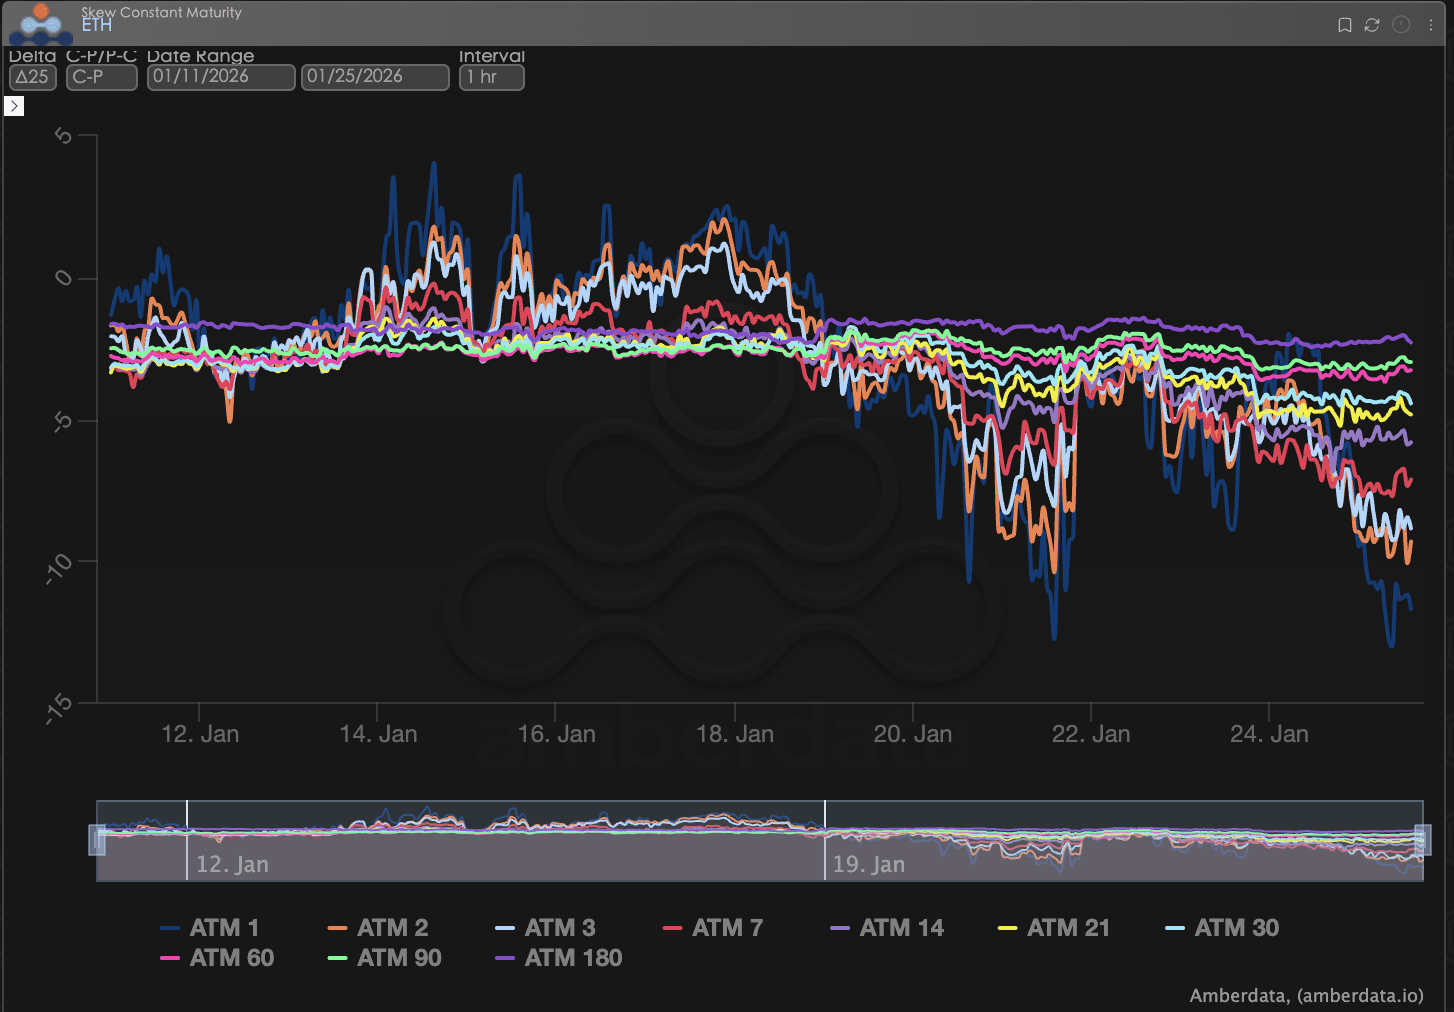
Skew: The shadow of short-term sentiment
By observing Delta 25 Skew (implied volatility IV of call options - IV of put options), the magnitude of this negative value reflects the market's hedging demand against tail risks.
Skew Observation: In recent days, the Skew of ATM (at-the-money) options has significantly dipped. Specifically, the Skew curve slope for the near term (ATM 1, ATM 3, ATM 7) has become steeper, reflecting that hedging funds are frantically purchasing short-term put options to defend against potential volatility from sudden events.
In-depth interpretation: This characteristic of 'extreme panic at the near end and little change at the far end' indicates that the market sees the current turmoil as an 'acute macro allergy' rather than a long-term fundamental reversal. Investors are not optimistic about the upcoming week's trend, but maintain a relatively neutral pricing perspective over the long term of 90-180 days.
BTC & ETH
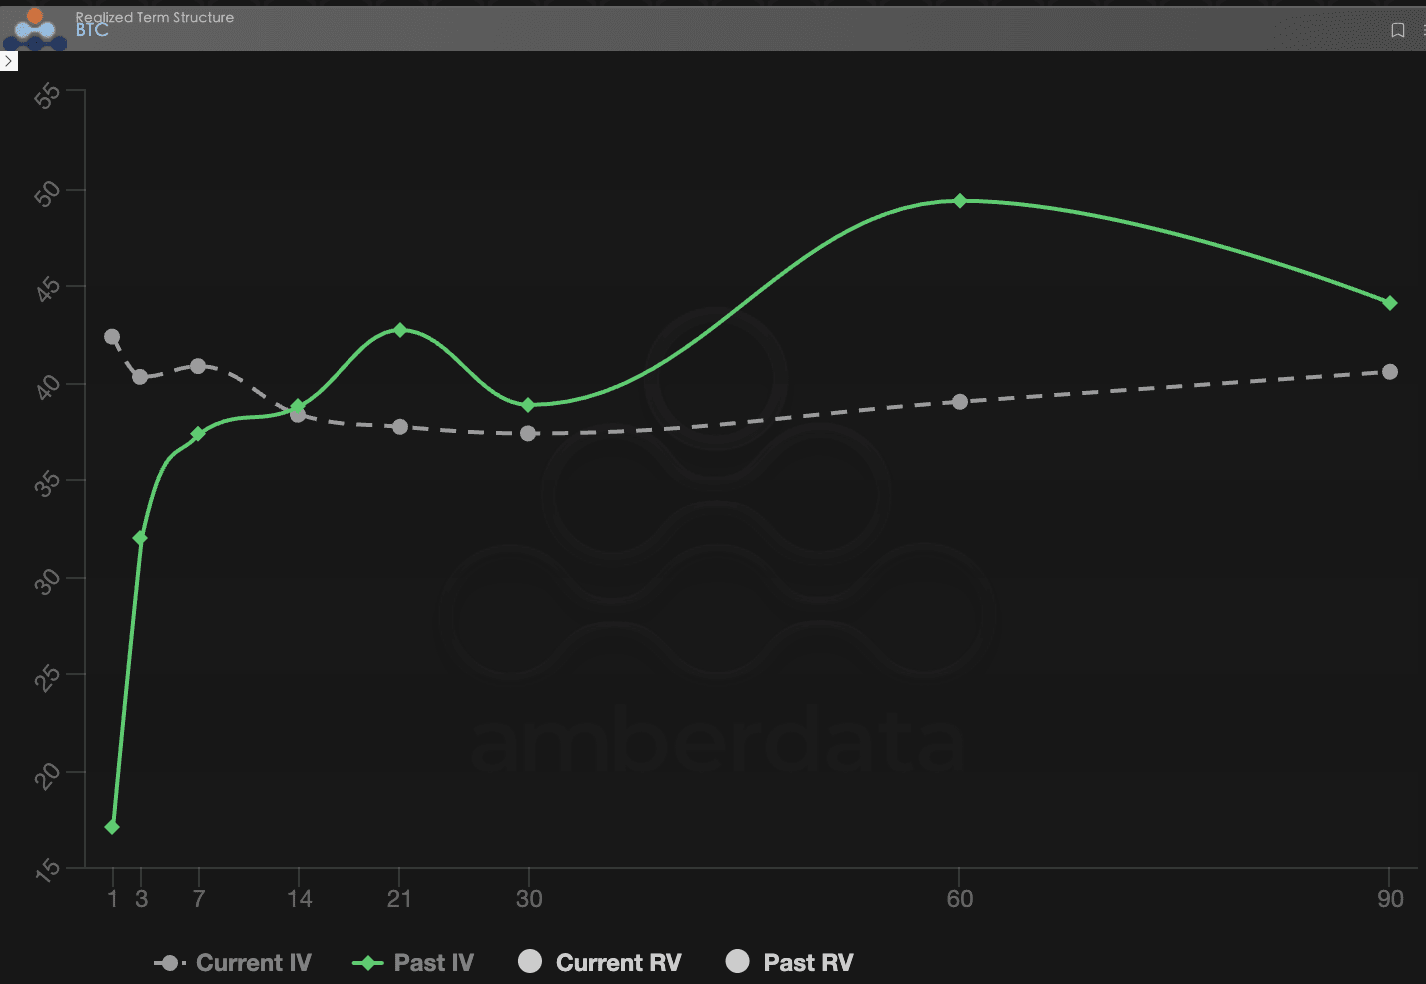
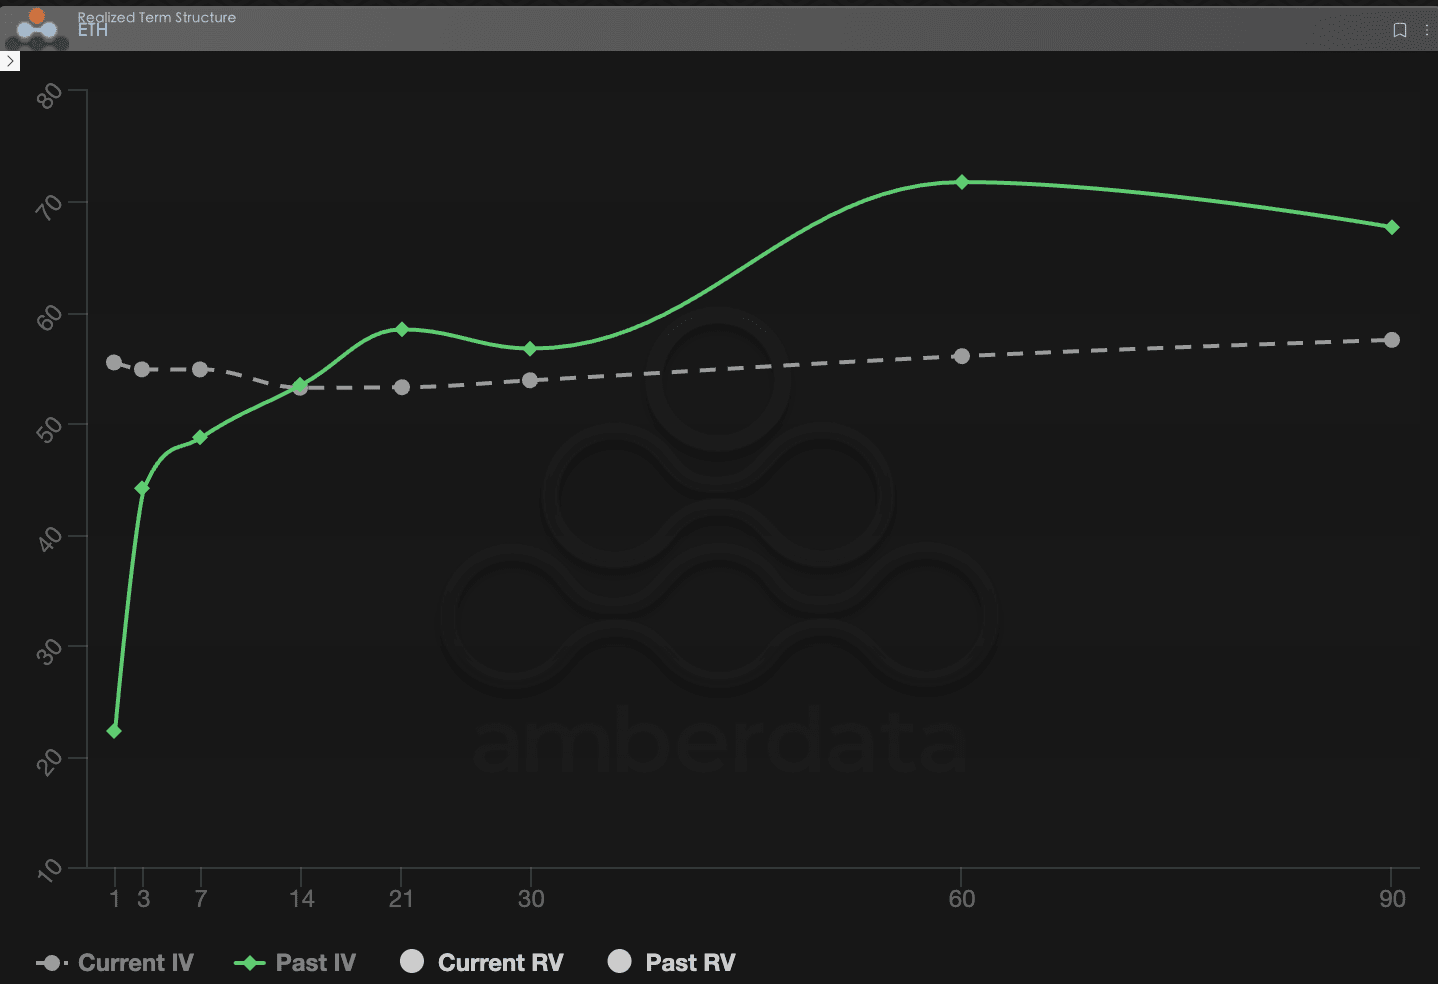
Term Structure: From Contango to Inversion
Term Structure displays the distribution of Implied Volatility (IV) across different expiration times.
Shape anomaly: Last week's curve was still in a healthy Contango (far high near low) state, reflecting the market's normalized hedging demand. However, this week, the Current IV curve experienced a drastic 'left-end lift,' evolving into a clear inversion (Backwardation) shape.
In-depth interpretation: The inverted shape indicates that the market is paying an extremely expensive insurance premium for the 'immediate danger.' This upward movement in IV is not gradual but rather jumps. If macro noise cannot subside, this inversion may last for a considerable time, thereby suppressing the willingness of bulls to buy physical assets.
BTC
ETH
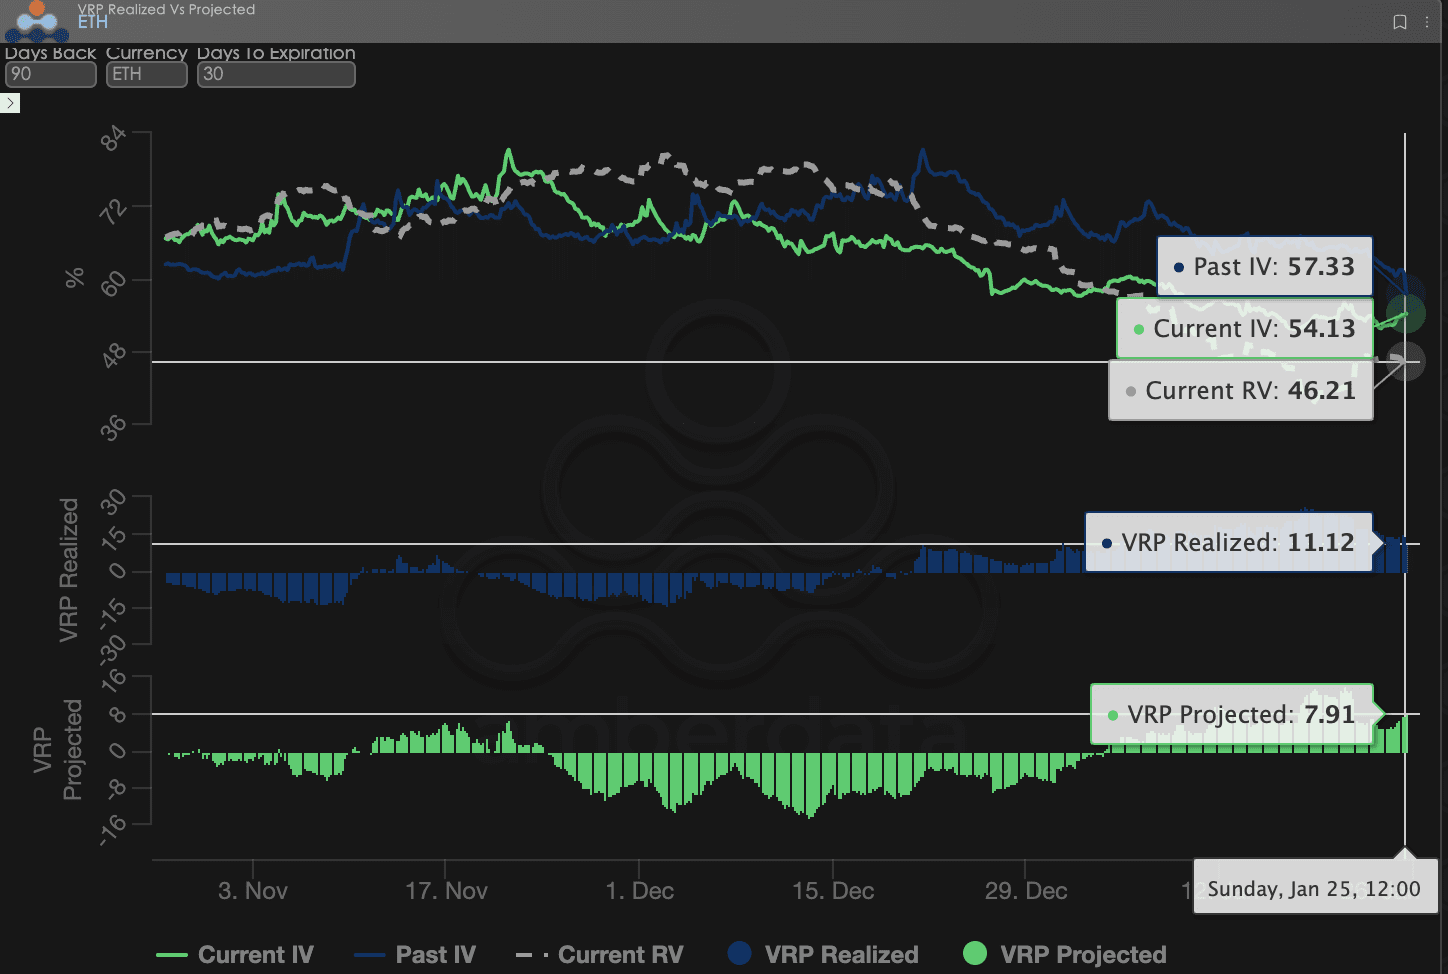
Volatility Risk Premium (VRP): Compression of seller profit margins
VRP (Volatility Risk Premium = Implied Volatility IV - Realized Volatility RV) is an important indicator of whether options pricing is reasonable. The current market is in a correction phase.
Dynamic trend: This week, IV overall experienced a drastic peak. Midweek, due to the Greenland event, IV spiked instantly, although it slightly retreated over the weekend, the overall center has been raised.
VRP compression: It is worth noting that the current VRP Realized and VRP Projected have both dropped to single digits, whereas last week, this figure was still in the double-digit range.
In-depth interpretation: For BTC, as IV spikes and then recedes while RV is forcibly lifted by macro events, the safety cushion for sellers is thinning. The current VRP level indicates that, as an options seller, the tail risk you bear is disproportionate to the premium income you receive. The profit margin for ETH is slightly higher than for BTC.
BTC & ETH
Options data: Traders' 'third eye' and multi-dimensional pricing power
In the complex macro environment of 2026, simple price trends often lag, while options data serves as the traders' 'third eye,' able to penetrate the surface and reveal the true defensive boundaries of capital.
For different trading styles, the observed data dimensions should be significantly different:
Short-term/intraday traders (Gamma Scalpers): Should closely monitor the Gamma Exposure (GEX) distribution for 1-3 dte. For instance, during the legislative volatility on January 15, the concentrated strike prices of GEX formed strong physical support and resistance, helping short-term funds exit precisely before liquidity dried up.
Trend/swing traders (Swing Traders): Should focus on 25 Delta Skew and VRP Projected. If the Skew remains at extremely low negative values while VRP remains high, it often indicates excessive market panic, serving as a classic 'contrarian buying' signal.
Institutions/long-term hedgers (Hedgers): Need to penetrate the Term Structure to observe changes in far-end Vega. By comparing the Current IV with the 90-day average deviation, one can determine whether the current 'insurance' is too expensive, thus deciding whether to directly buy puts or construct more complex combination strategies.
Options data provides dual dimensions of 'probability' and 'cost.' To help investors better capture these asymmetric opportunities, Sober Options Studio now offers [Customized Options Data Tracking Research Report] services, providing in-depth insights tailored to your specific positions and risk preferences; feel free to inquire privately.
3. Options Strategy Recommendation: Locking Downside Risk with Bear Put Spread Strategy
In light of the pricing environment of 'extreme panic at the near end and relative calm at the far end' in January 2026, we do not recommend that investors directly buy long put options, as the significant gap in near-term implied volatility indicates that the 'insurance premium' is at a cyclical high. At this time, the bear put spread strategy is the most cost-effective hedging tool.
3.1 Strategy Construction (using BTC as an example)
Buying long put options: Buy 1 near-month OTM Put with a Delta of about -0.4 (e.g., strike price slightly below current price by 5%-8%).
Selling short put options: Simultaneously sell 1 deep out-of-the-money OTM Put with the same expiration date and a Delta of about -0.2 (e.g., strike price below current price by 15%-20%).
3.2 Recommended Logic: Using 'volatility inversion' to reduce costs and increase efficiency
Offsetting expensive Theta decay: As indicated in the second part of the data, the current near-term options have extremely high IV, which means the time value loss (Theta Decay) of options is very fast. By selling deeper out-of-the-money puts, we can recover part of the premium, significantly reducing the holding cost of the hedging position.
Avoiding the risk of IV drop: The current VRP space is narrowing; once the tariff ruling is finalized or macro sentiment stabilizes, IV may experience a Volatility Crush. The bear put spread, through the combination of buying and selling, utilizes the relative changes in IV between two strike prices, effectively resisting the collective drop in Vega dimensions that could damage the position.
Precise protection for 'black swan' intervals: Considering the lag of BTC as a risk asset in the first stage of hedging, this strategy can provide a clear 'safety cushion' for accounts. Even in the event of a systemic liquidation triggered by something like 'Japanese bond market turmoil,' this strategy can provide robust payouts within the locked price range.
3.3 Practical Reminders
Compared to simply holding assets, bear put spreads perform excellently in a turbulent downtrend. If BTC prices remain volatile in late February (before the midterm election topics unfold), this strategy's maximum loss is limited to the net premium paid. Once a 'black swan' event triggers a deep correction, this strategy will provide valuable liquidity protection for physical positions.
4. Disclaimer
This report is based on publicly available market data and options theoretical models, aiming to provide investors with market information and professional analytical perspectives. All content is for reference and communication purposes only and does not constitute any form of investment advice. Cryptocurrency and options trading carry extremely high volatility and risk, which may lead to the total loss of principal. Before adopting any trading strategy, investors should fully understand the characteristics, risk attributes of options products, and their own risk tolerance, and must consult professional financial advisors. The analysts of this report do not bear responsibility for any direct or indirect losses arising from the use of this report's content. Past market performance does not predict future results; please make rational decisions.
Co-produced by: Sober Options Studio × Derive.XYZ