$SPCXB /USDT: Momentum Is Building, But the Daily Range Still Matters
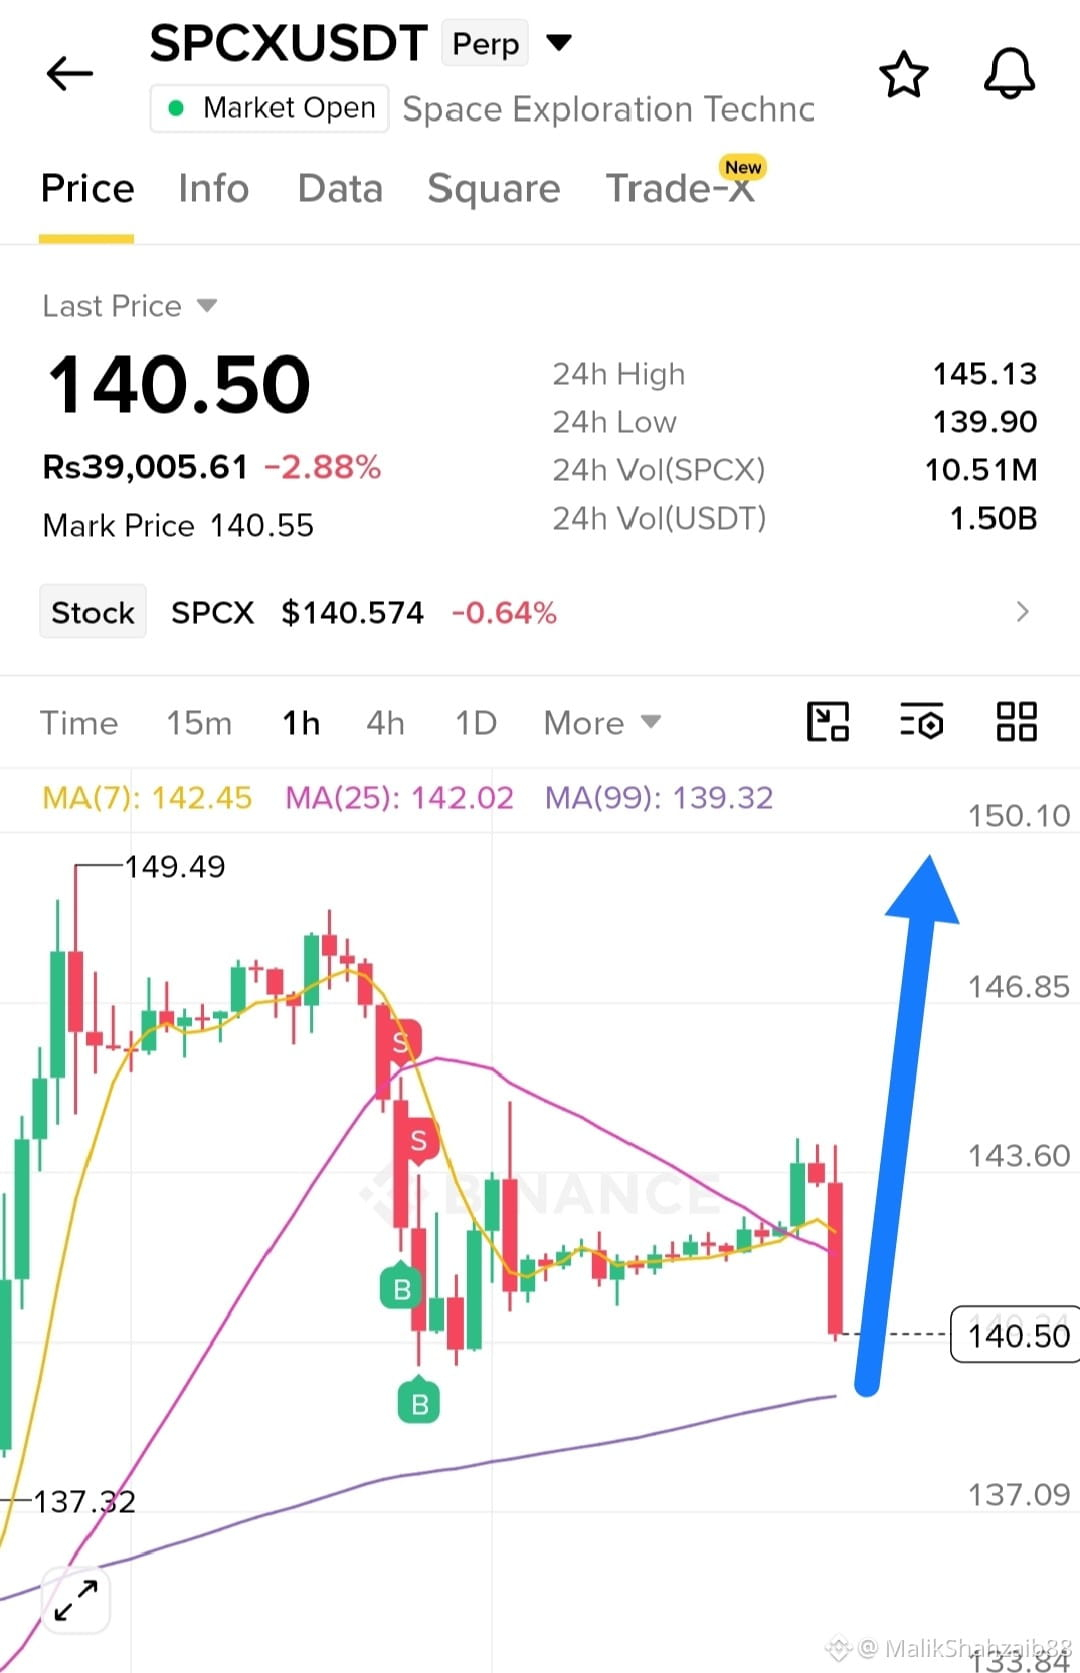
$SPCXB /USDT is showing an interesting short-term setup after buyers stepped back into the market.
The 4H structure has turned constructive, suggesting that bulls currently have the advantage on the lower timeframes. However, the bigger daily picture remains range-bound, which means this move still needs confirmation before being treated as a genuine breakout.
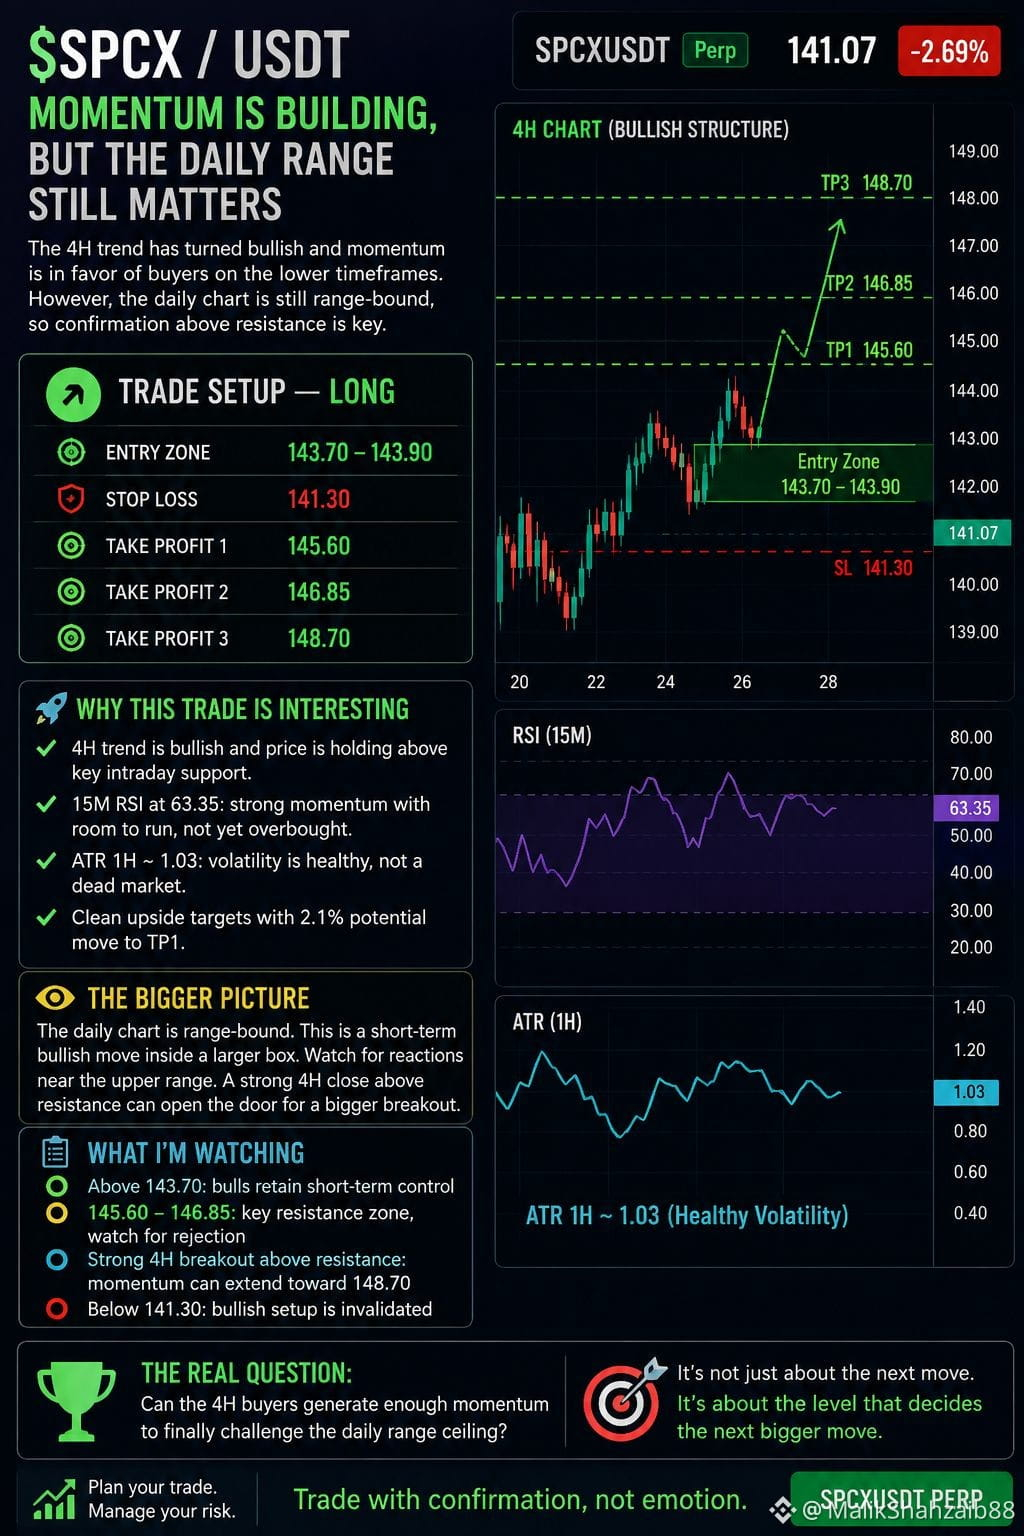
Trade Setup — 🟢 LONG
Entry: 143.70 – 143.90
Stop Loss: 141.30
TP1: 145.60
TP2: 146.85
TP3: 148.70
Why this trade is interesting
The key point here is the alignment between the 4H trend and short-term momentum. Price is holding above the recent intraday support area, while the 15M RSI remains strong without reaching an extreme level.
That leaves room for another push higher if buyers continue defending the entry zone.
Volatility is also active enough to support a move toward the nearby resistance levels. With 1H ATR sitting around 1.03, the market has enough movement to produce a meaningful intraday expansion rather than simply drifting sideways.
The bigger picture
The daily chart is where traders need to stay cautious.
This isn't necessarily a breakout trade yet. It's better viewed as a short-term bullish move developing inside a broader daily range.
If price reaches the upper part of that range and sellers appear, TP2 could become a natural area for profit-taking. On the other hand, a strong 4H close above the daily resistance zone could completely change the structure and open the door toward TP3.
What I'm watching
🟢 Above 143.70: bulls retain short-term control
🟡 Around 145.60–146.85: watch for rejection and profit-taking
🚀 Strong 4H breakout above resistance: momentum could accelerate toward 148.70
Trade here 🚀👇
$SPCXB /USDT is showing an interesting short-term setup after buyers stepped back into the market.
The 4H structure has turned constructive, suggesting that bulls currently have the advantage on the lower timeframes. However, the bigger daily picture remains range-bound, which means this move still needs confirmation before being treated as a genuine breakout.
Trade Setup — 🟢 LONG
Entry: 143.70 – 143.90
Stop Loss: 141.30
TP1: 145.60
TP2: 146.85
TP3: 148.70
Why this trade is interesting
The key point here is the alignment between the 4H trend and short-term momentum. Price is holding above the recent intraday support area, while the 15M RSI remains strong without reaching an extreme level.
That leaves room for another push higher if buyers continue defending the entry zone.
Volatility is also active enough to support a move toward the nearby resistance levels. With 1H ATR sitting around 1.03, the market has enough movement to produce a meaningful intraday expansion rather than simply drifting sideways.
The bigger picture
The daily chart is where traders need to stay cautious.
This isn't necessarily a breakout trade yet. It's better viewed as a short-term bullish move developing inside a broader daily range.
If price reaches the upper part of that range and sellers appear, TP2 could become a natural area for profit-taking. On the other hand, a strong 4H close above the daily resistance zone could completely change the structure and open the door toward TP3.
What I'm watching
🟢 Above 143.70: bulls retain short-term control
🟡 Around 145.60–146.85: watch for rejection and profit-taking
🚀 Strong 4H breakout above resistance: momentum could accelerate toward 148.70
Trade here 🚀👇