$SPCX Chart Analysis on Different Time Frames.
Trend: The market has made a strong reversal from the low of $104.31 on the daily chart.
The price is trading above both the EMA(7) at $137.82 and the EMA(25) at $129.71, which shows that the overall trend is bullish.
Previous Major Barrier: The next major target and resistance on the upside is around $176.95.
4-Hour Chart (4-hour time frame - medium term)
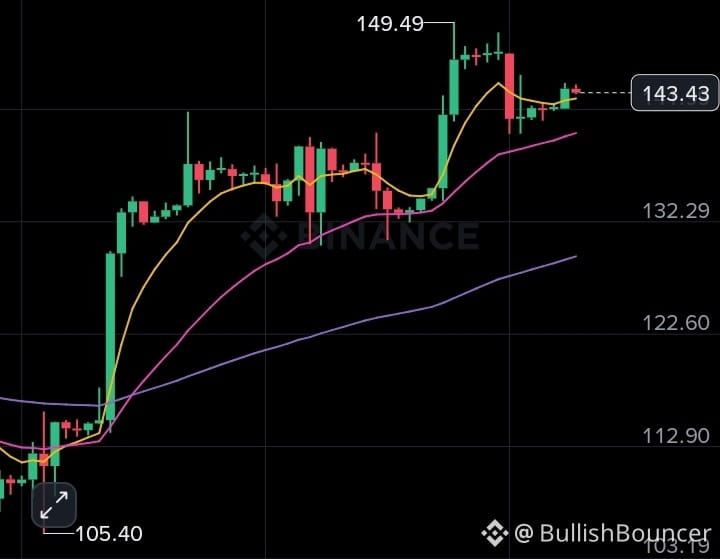
The market continued to move above $105 to make a high of $149.49.
After making the high, there was a slight pullback/correction and the price is consolidating in the $140 – $143 zone.
Here, both EMA(7) and EMA(25) are providing support to the price on the upside.
1-Hour Chart (1-hour time frame - short term / intraday)
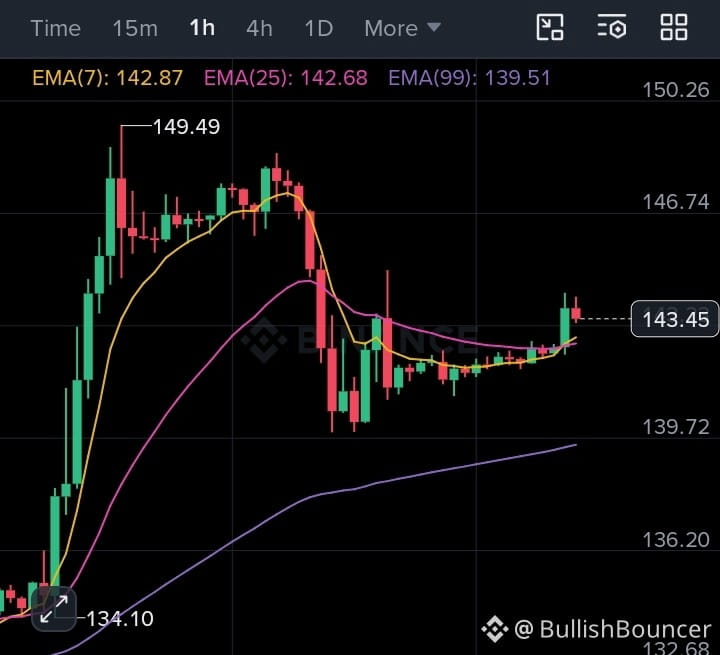
After falling from $149.49, the price found support near $139.70 – $140.00 and recovered to around $143.37.
The market looks set to resume its next move higher in the short term.Key Support & Resistance Levels
🔴 Major Resistance 2: $170.00 – $176.95
(Previous daily swing high; expect heavy selling pressure/profit-taking here)
🔴 Immediate Resistance 1: $149.50
(Recent local high; a confirmed 4H candle close above this level is required for a breakout)
🟢 Immediate Support 1: $139.50 – $140.00
(Short-term bounce zone and intraday dynamic support)
🟢 Major Support 2: $134.00 – $129.00
(EMA 25 Daily confluence; strong demand zone if a pullback occurs)
🎯 Trade Setup & Targets
Current Price (CMP): ~$143.35
Bullish Trigger: Breakout & 4H close above $149.50
Targets (TP):
🎯 TP 1: $155.00
🎯 TP 2: $165.00
🎯 TP 3: $175.00+
Stop Loss (SL): $138.50
$SPCX
Trend: The market has made a strong reversal from the low of $104.31 on the daily chart.
The price is trading above both the EMA(7) at $137.82 and the EMA(25) at $129.71, which shows that the overall trend is bullish.
Previous Major Barrier: The next major target and resistance on the upside is around $176.95.
4-Hour Chart (4-hour time frame - medium term)
The market continued to move above $105 to make a high of $149.49.
After making the high, there was a slight pullback/correction and the price is consolidating in the $140 – $143 zone.
Here, both EMA(7) and EMA(25) are providing support to the price on the upside.
1-Hour Chart (1-hour time frame - short term / intraday)
After falling from $149.49, the price found support near $139.70 – $140.00 and recovered to around $143.37.
The market looks set to resume its next move higher in the short term.Key Support & Resistance Levels
🔴 Major Resistance 2: $170.00 – $176.95
(Previous daily swing high; expect heavy selling pressure/profit-taking here)
🔴 Immediate Resistance 1: $149.50
(Recent local high; a confirmed 4H candle close above this level is required for a breakout)
🟢 Immediate Support 1: $139.50 – $140.00
(Short-term bounce zone and intraday dynamic support)
🟢 Major Support 2: $134.00 – $129.00
(EMA 25 Daily confluence; strong demand zone if a pullback occurs)
🎯 Trade Setup & Targets
Current Price (CMP): ~$143.35
Bullish Trigger: Breakout & 4H close above $149.50
Targets (TP):
🎯 TP 1: $155.00
🎯 TP 2: $165.00
🎯 TP 3: $175.00+
Stop Loss (SL): $138.50
$SPCX