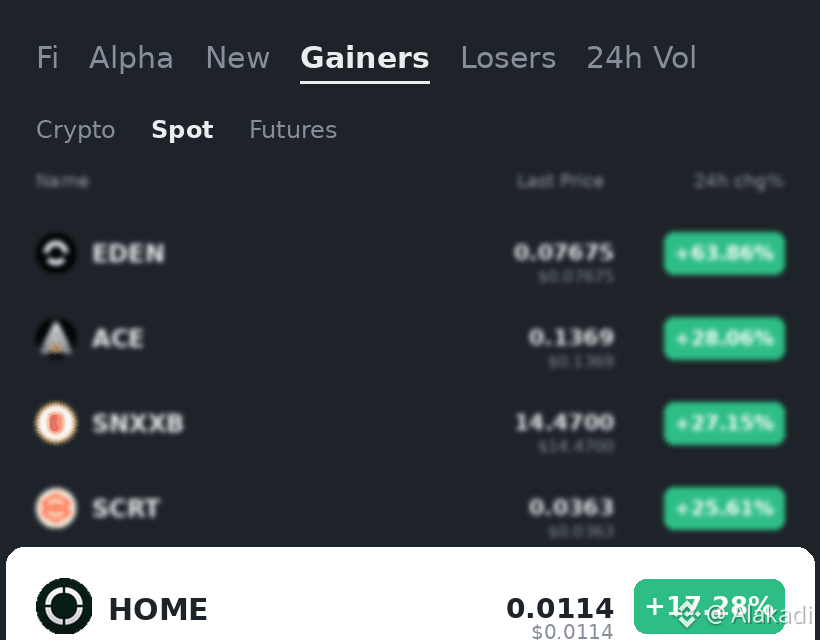
$HOME Jumps 15.8%, but the volume reveals the trap—are we witnessing a real breakout or a liquidity trap?
The setup and data:
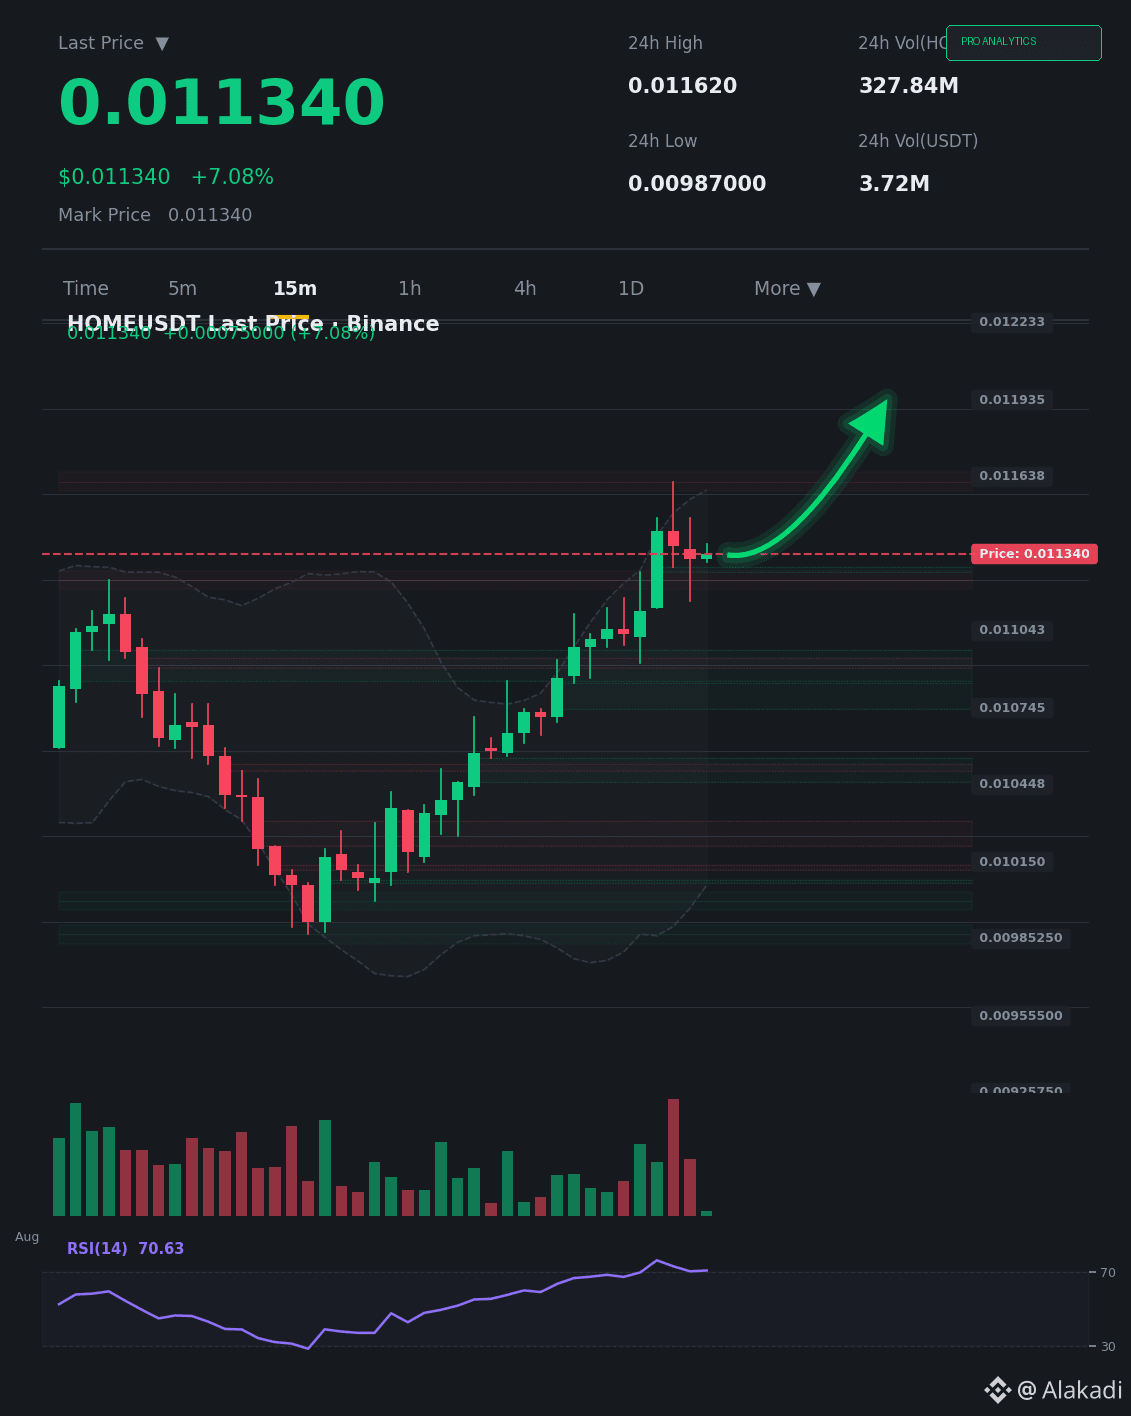
The price is holding at 0.01134 with a clear upward bias on the 15-minute chart, but the volume ratio (Vol Ratio) at 0.06 indicates almost nonexistent liquidity compared to the normal rate. The current move is driven by very few buy orders in the order book, which makes the rising candles fragile and vulnerable to a sharp reversal at the first sell pressure. Volatility indicators like RSI are approaching overbought zones without volume confirmation.
Possibilities:
The positive scenario: a sudden influx of institutional liquidity boosts volume above 1.0, turning the breakout into a sustained trend with higher targets.
The negative scenario: weak volume persists, leading to a classic “fakeout,” where price sweeps stop orders above the last high, then drops strongly to restore balance.
Bottom line:
Volume is the only judge—without it, the move is merely a temporary liquidity maneuver.
Do you see genuine buyer entries, or is the market hunting stop orders above the current levels?
$HOME
This content is not investment advice—do your own research (DYOR)
The setup and data:
The price is holding at 0.01134 with a clear upward bias on the 15-minute chart, but the volume ratio (Vol Ratio) at 0.06 indicates almost nonexistent liquidity compared to the normal rate. The current move is driven by very few buy orders in the order book, which makes the rising candles fragile and vulnerable to a sharp reversal at the first sell pressure. Volatility indicators like RSI are approaching overbought zones without volume confirmation.
Possibilities:
The positive scenario: a sudden influx of institutional liquidity boosts volume above 1.0, turning the breakout into a sustained trend with higher targets.
The negative scenario: weak volume persists, leading to a classic “fakeout,” where price sweeps stop orders above the last high, then drops strongly to restore balance.
Bottom line:
Volume is the only judge—without it, the move is merely a temporary liquidity maneuver.
Do you see genuine buyer entries, or is the market hunting stop orders above the current levels?
$HOME
This content is not investment advice—do your own research (DYOR)