$EDEN
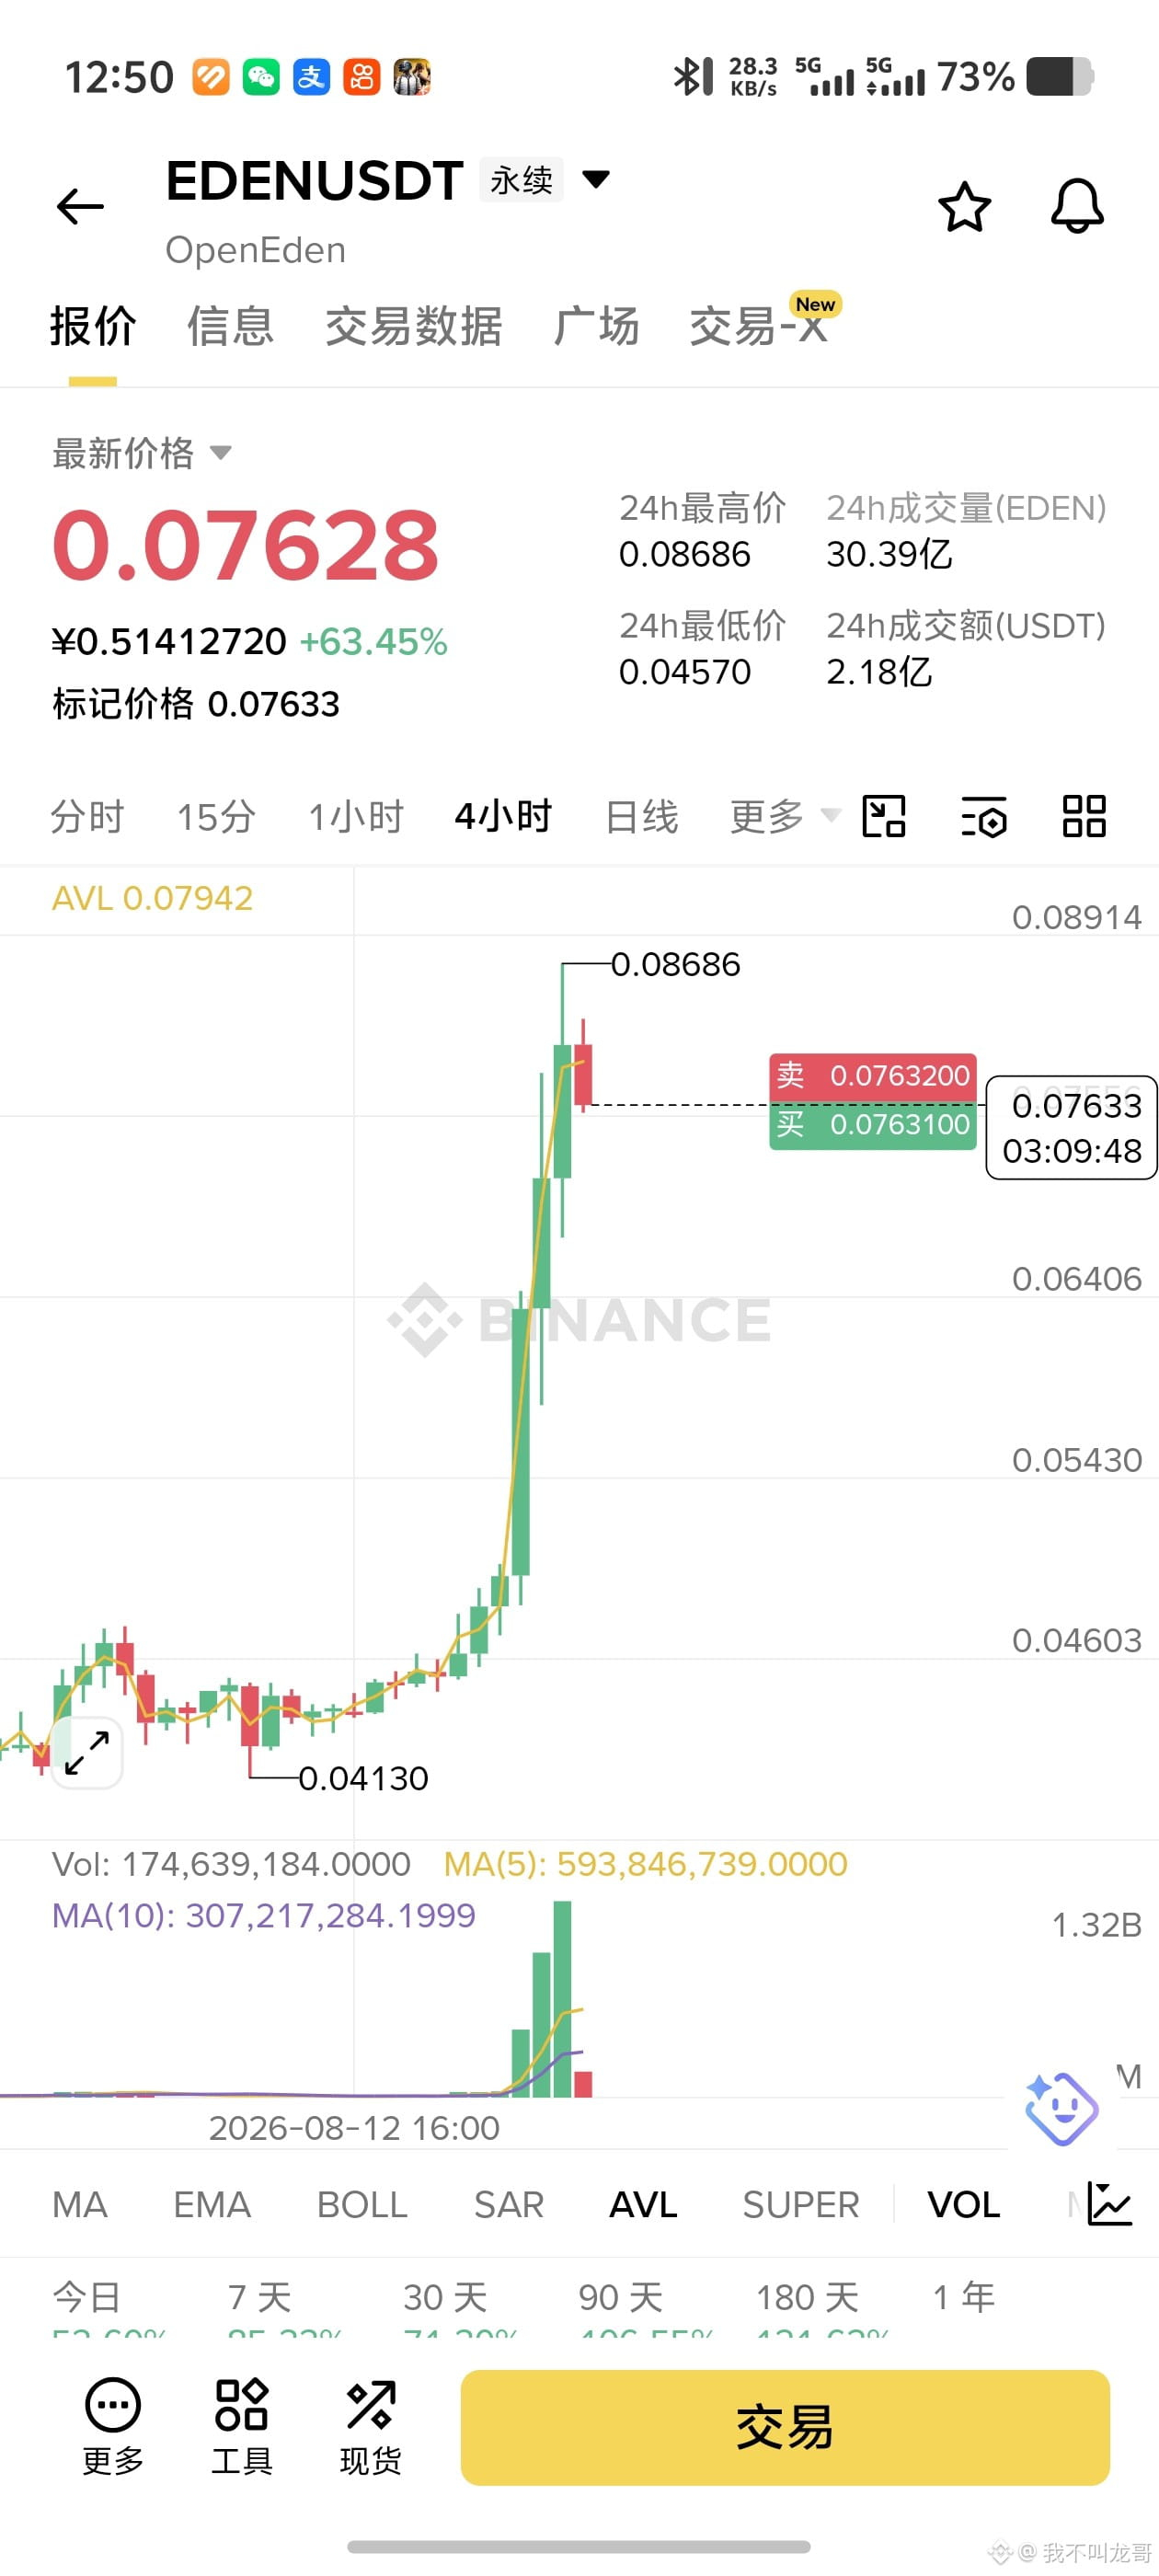
From the 4-hour K-line chart, the price has undergone a nearly vertical surge, rapidly rising from around 0.04130 to a peak of 0.08686, with a gain of over 100%. At present, the K-line has formed a bearish candle with a long upper shadow, and the price has pulled back to around 0.07628, indicating heavier selling pressure overhead and that bullish momentum is weakening. In terms of volume, a massive volume was released during the surge (Vol is significantly higher than MA5 and MA10), but during the subsequent pullback, volume contracted. This usually suggests that the main capital has not fully exited; instead, it is more likely the realization of short-term profits. The AVL indicator shows the average price at 0.07942. The current price has fallen below the average line, so short-term support has weakened.
Trading strategy suggestions
Given that we are currently in a phase of extreme volatility after a sharp spike, it is recommended to adopt a “right-side trading” approach or a “buy-the-dip at key levels” strategy. Do not chase prices blindly.
Aggressive long entry points: Focus on the 0.0720 - 0.0735 range. This is a small breakout point/platform during the earlier surge. If the price retests this area without breaking and forms a lower shadow, you may consider a small-position rebound trade.
Conservative long entry points: Wait for a pullback to around 0.0640 - 0.0650. This is the top of the launch platform before this main rally started, with stronger support and a higher margin of safety.
Stop-loss level: If it falls below 0.0600, it means the uptrend has been broken. In that case, cut losses decisively and exit.
Take-profit targets: The first target is near the previous high at 0.0850; the second target is the 0.0900 round-number level.
Short-selling idea: If a rebound to 0.0800 - 0.0820 fails and encounters resistance (unable to break the prior high), you may attempt a short trade. Set the stop-loss above 0.0870, with the target being a pullback to around 0.0740
From the 4-hour K-line chart, the price has undergone a nearly vertical surge, rapidly rising from around 0.04130 to a peak of 0.08686, with a gain of over 100%. At present, the K-line has formed a bearish candle with a long upper shadow, and the price has pulled back to around 0.07628, indicating heavier selling pressure overhead and that bullish momentum is weakening. In terms of volume, a massive volume was released during the surge (Vol is significantly higher than MA5 and MA10), but during the subsequent pullback, volume contracted. This usually suggests that the main capital has not fully exited; instead, it is more likely the realization of short-term profits. The AVL indicator shows the average price at 0.07942. The current price has fallen below the average line, so short-term support has weakened.
Trading strategy suggestions
Given that we are currently in a phase of extreme volatility after a sharp spike, it is recommended to adopt a “right-side trading” approach or a “buy-the-dip at key levels” strategy. Do not chase prices blindly.
Aggressive long entry points: Focus on the 0.0720 - 0.0735 range. This is a small breakout point/platform during the earlier surge. If the price retests this area without breaking and forms a lower shadow, you may consider a small-position rebound trade.
Conservative long entry points: Wait for a pullback to around 0.0640 - 0.0650. This is the top of the launch platform before this main rally started, with stronger support and a higher margin of safety.
Stop-loss level: If it falls below 0.0600, it means the uptrend has been broken. In that case, cut losses decisively and exit.
Take-profit targets: The first target is near the previous high at 0.0850; the second target is the 0.0900 round-number level.
Short-selling idea: If a rebound to 0.0800 - 0.0820 fails and encounters resistance (unable to break the prior high), you may attempt a short trade. Set the stop-loss above 0.0870, with the target being a pullback to around 0.0740