Last time, we talked about support levels, which refer to areas where once the price drops into a certain zone, buying interest increases and the price is more likely to stop falling. But when the price keeps moving upward, won’t it also hit some positions where it feels like, no matter how it rises, it just can’t go higher?
This is the resistance level we’ll discuss today.
TradingBox Market # 0⃣2⃣|What is a resistance level?
1. What is a resistance level?
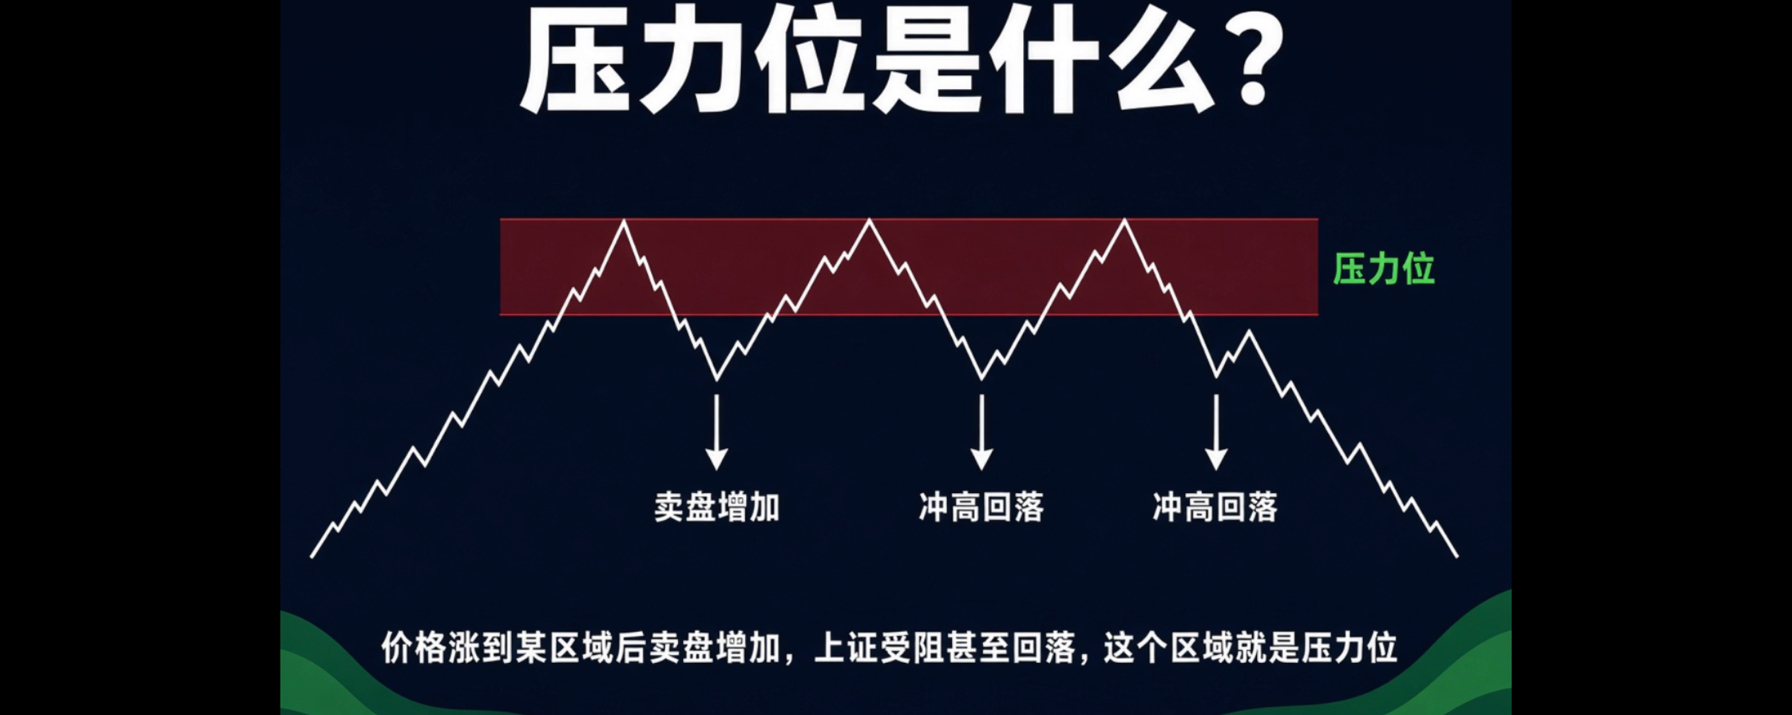
In simple terms, after the price rises into a certain area, sell orders start to increase. The difficulty of pushing the price higher grows, and it may even pull back. This area can be understood as a resistance level.
For example, if BTC rises from $80,000 to $950,000, and near $950,000 it repeatedly surges upward but fails to break through; then the price falls back. After some time, BTC rises to this level again and hits resistance once more. Then around $950,000 becomes a resistance zone worth paying attention to.
As with the support level from the previous episode, pay attention to one concept here: resistance levels are usually a zone, not a precise “line” at a single price.
2: Why does resistance form?
Resistance levels are also related to past trading behavior.
If a certain price area saw relatively clear selling in the past, or if the price has repeatedly risen to this point without successfully breaking through, market participants will gradually form a “memory” of this zone. Some may choose to take profit here, while others may think the price has already risen to a relatively high level and start selling. Also, some previously trapped positions may choose to exit when the price finally climbs back near their cost.
As these sell orders gradually increase, it becomes harder for the price to keep rising—so this zone becomes resistance.
3: How to tell whether resistance is strong or weak?
When actually monitoring the chart, you can focus on three aspects.
1: Past price reactions
First, check whether this zone has seen multiple instances of price surging and then pulling back. If the price keeps coming to this area and fails to break through, and each pullback is quite obvious, it usually means the market’s attention to this spot is relatively high.
2: Changes in trading volume
Next, look at the trading volume when the price approaches the resistance zone. If the price keeps rising but the volume doesn’t clearly follow through, you should be careful and consider whether the upward push is strong enough. If there’s a noticeable increase in volume when the price breaks the resistance, it’s usually more worth paying attention to.
3: Performance after the breakout
Finally, and most importantly: resistance levels are not necessarily impossible to break. After price truly breaks through, you still need to observe whether it can hold steady. If it quickly falls back into the original resistance zone, then that breakout should be treated with caution. If, after breaking out, the price can hold, and subsequent pullbacks don’t break down again, then this resistance may have become invalid.
4. What happens after a resistance breakout?
This lines up perfectly with last episode’s “support turning into resistance.”
If BTC encounters resistance near $950,000 for the long term, and later, on a particular rise, it breaks above $950,000 with increased volume; then the price pulls back to revisit this area but doesn’t keep falling—instead, it finds support here—then the original resistance zone may turn into a new support.
So in candlestick analysis, you’ll often see the terms “resistance turning into support” and “support turning into resistance.” In essence, both describe the result of a change in market buying and selling power.
5. So when looking at resistance levels, what exactly are we looking at?
Like with support levels, what we really care about isn’t “whether the price will definitely not drop once it reaches here,” but rather what changes the market shows after the price comes into this zone.
Is the sell-side increasing? Is the upward momentum weakening? Has the trading volume changed? If a breakout happens, can the price hold above the level?
Only by putting these factors together can you judge whether a specific resistance zone is truly meaningful.
At this point, support and resistance are basically connected: when the price falls, we look for where buying might appear; when the price rises, we look for where selling might appear.
In the next episode, we’ll take one step further:
If we understand both support and resistance, then what exactly is a “breakout”?
Why do some breakouts keep running upward, while others quickly fall back again?
If anything else isn’t clear, keep your paws up 🙋