
Hello everyone, I am Lao Liu
Today is August 14, 2026
Friday
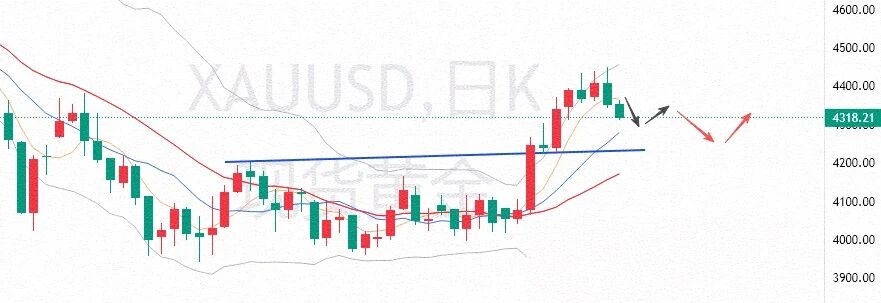
Gold yesterday saw a brief, sentiment-driven spike and tested resistance around 4450 in the early part of the Asian session, then was rejected and fell back to adjust. After the evening price action confirmed the pressure at 4400, the adjustment expanded further. The low eventually dropped to around 4343. On the daily chart, it closed with a bearish long-bodied candle with an upper shadow, breaking below the 5-day moving average.
The pullback and adjustment in gold’s decline yesterday were completely within expectations. The morning resistance at 4450, the evening resistance at 4400, and even the eventual break below the 5-day moving average all clearly indicated that gold’s short-term move is a technical retracement and adjustment. Today’s early session gold again met resistance at the 5-day moving average and continued the downward trend. Although there was some sentiment impact at the start of the Asian session, the overall pace still matches expectations. The likelihood of testing the 10-day moving average on the downside during the day is gradually increasing. Currently, the 10-day moving average has risen to around 4280; however, this downward momentum may not be held back by the 10-day line. The main support below could shift down to around 4230.
Based on the hourly chart, today’s early-session decline is another wave of emotional release. For the short term, consider support around 4320–00, but it may not be able to hold. Especially, it may be hard to withstand the test of time. If price breaks below, it is necessary to shift the support target down to around 4230.
Yesterday’s market put pressure at 4450. In the evening, it again, as expected, came under pressure at 4400. Currently, the market is also under pressure at 4360 and has fallen. This basically pins down the strong resistance above for the session at around 4360–4370, which is near the 5-day line. In reality, if today cannot reclaim and hold above 4345, it will basically confirm that there will be continued downward moves afterward.
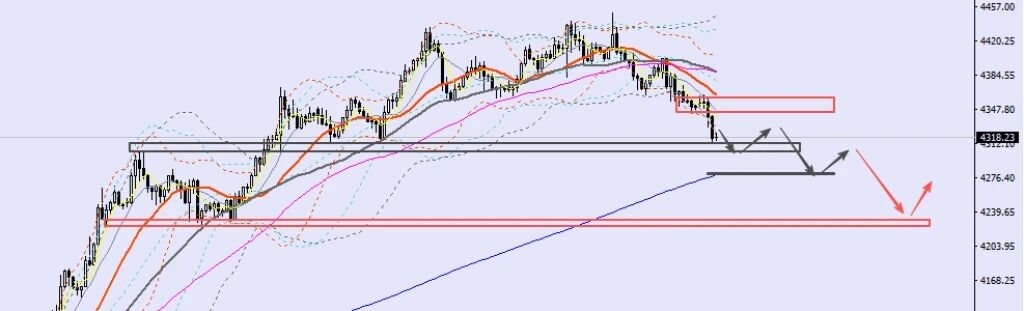
For intraday trading, the main line is still to focus on corrections. Existing short positions can be kept, and you can also continue to favor shorter-term shorts at the high end. As long as price has not yet reached the 10-day moving average, for now do not attempt any short-term long entries.
Overnight there are short positions around 4400, and there are also leftover short positions taken earlier at higher levels. These may be continued with good risk control: keep break-even stop-losses and hold them. If the market pulls back to the 4300–4280 area, then reduce positions there. You may also keep part of the positions to see whether the market pulls back further to the 4250–4230 area, and then make the final exit on a short-term basis.
The downside has already been released—do not blindly chase shorts. If you want to take another short-term short intraday, you may refer to entries around the rebound at 4340–4345, with a stop-loss above 4350.
If the market keeps rebounding, you can also try another short around 4360–4365, with a stop-loss above 4370. The target is unified to reduce positions around 4320 with a move to a break-even stop-loss; for the remaining open positions, look to reduce around 4300 and 4280.
For the first intraday pullback down to around the 10-day line near 4280, if there is supportive action, the aggressive traders can try a light-load short-term long. If price directly pierces this level, give up this setup. The specific strategy should be adjusted in real time during live trading.
[Crude Oil Analysis]
Last night, WTI crude also fell back as expected under pressure during the adjustment. During the late-session hours, the low briefly pulled back to around 80, then the market rebounded quickly and retested around 82.7. But later during the second half of the night, it pulled back and adjusted again. In the end, the daily chart still closed with a bearish candle. It has broken through the moving-average zone throughout the move. Technically, there is an expectation of a shift toward bearishness. In addition, the news related to the US-Iran situation is still unclear, making it hard to discern signals. Therefore, the short-term market is stuck in a stalemate.
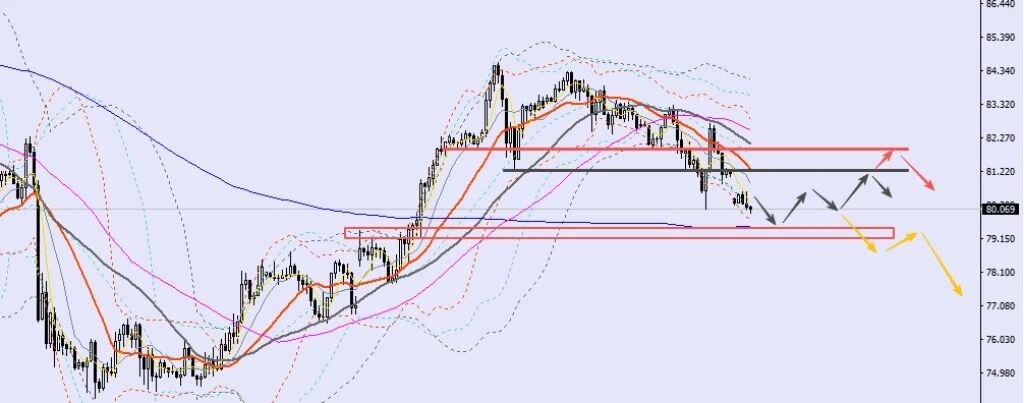
According to the current direction of the WTI crude hourly chart, it is expected that intraday WTI will most likely maintain a weak sideways consolidation. For intraday, you can shift the short-term resistance lower to the 81.0–82 area, and the stronger resistance is seen around 82. On the downside, continue to watch the contest around the 80 whole-number level first, but the main support may be pushed toward the 79.5–80 area.
In terms of trading, the intraday main idea is still range-bound consolidation, and you can still lean toward shorting. However, the difficulty of participation may increase, so if you are conservative, it may be better to stay on the sidelines and observe, then make timely adjustments based on the news impact.
For aggressive traders, focus on quick long at low and short at high around the 81.2–79.5 range; if expanding the range, look at 82–79.
The above is my personal view for reference only!#黄金