🔥 $DEXE .. From the accumulation floor to the blast gate 🔥
Take a close look at this chart—it doesn’t lie..
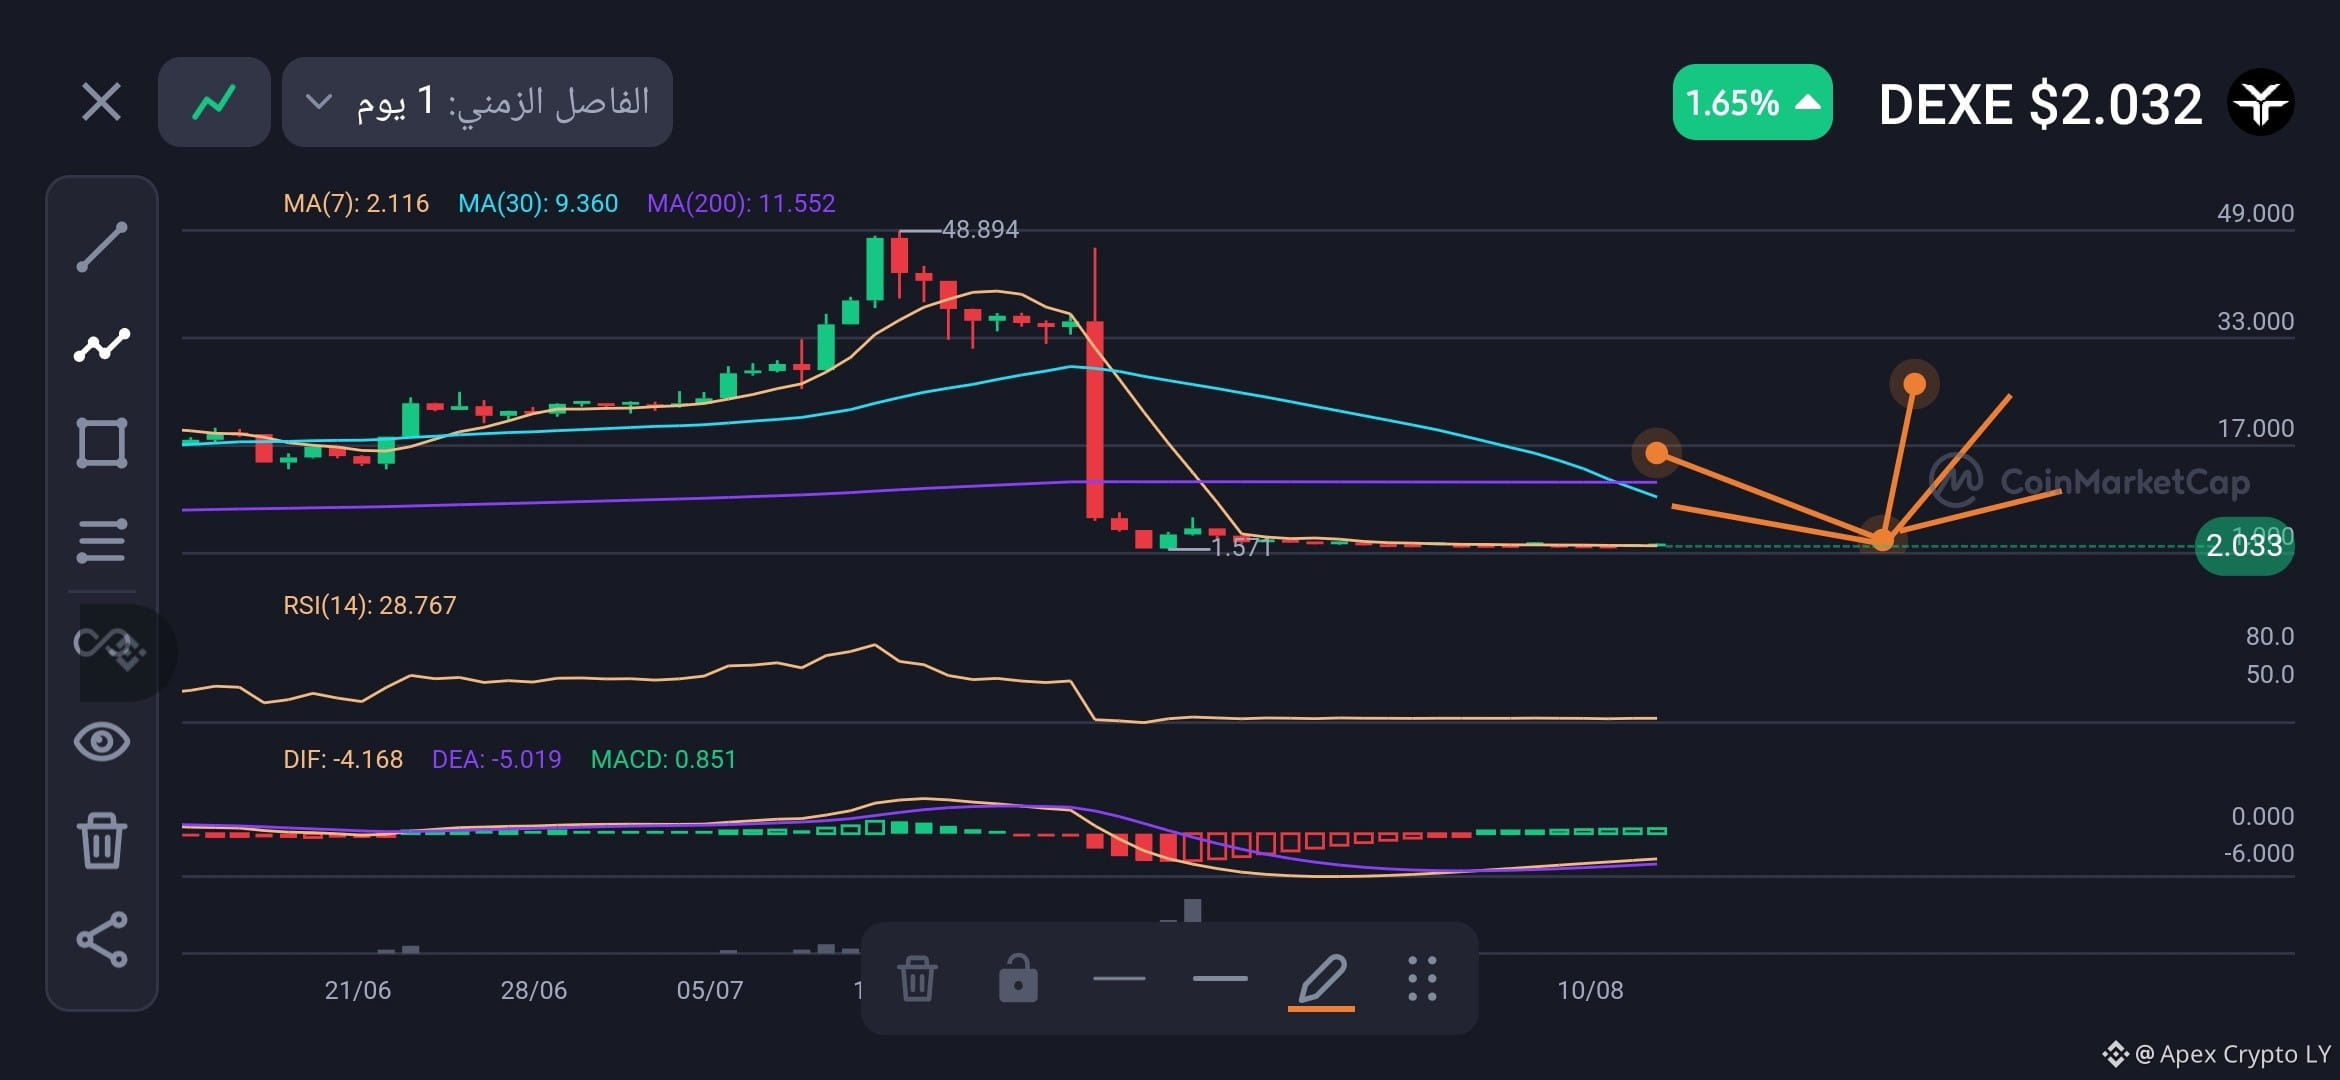
DEXE is trading now at $2.03 after a brutal drop from the $48 peak, and we’re now in a historical zone we haven’t seen since the start.
Why do I expect a rebound from here?
1. RSI (Relative Strength Index) at 28.7: We’ve reached an extreme oversold area—the same zone where the coin previously started to build a new peak. 2. MACD at the bottom: The curve has begun to turn upward positively—these are the first signs that the distribution is ending and accumulation is starting. 3. Distance from moving averages: The price is far away from the 200-day moving average at $11.55. This negative pressure doesn’t last long and is usually followed by a price explosion. 4. Clear accumulation zone: The price is moving sideways near the bottom, with a massive previous red candle that represents a complete liquidation process.. The whales accumulated, and that was it.
Expected targets:
The first bounce from this zone targets $19 as the first target—this is the key pivot resistance area.
If it breaks through with strong volume, the way opens toward $25 as a second potential target.
Remember: Markets reward patience, and opportunities are made in fear, not in greed.
This is an educational technical analysis, not investment advice. Do your own research and adhere to risk/capital management.
$DEXE #technical_analysis #digital_currencies
Take a close look at this chart—it doesn’t lie..
DEXE is trading now at $2.03 after a brutal drop from the $48 peak, and we’re now in a historical zone we haven’t seen since the start.
Why do I expect a rebound from here?
1. RSI (Relative Strength Index) at 28.7: We’ve reached an extreme oversold area—the same zone where the coin previously started to build a new peak. 2. MACD at the bottom: The curve has begun to turn upward positively—these are the first signs that the distribution is ending and accumulation is starting. 3. Distance from moving averages: The price is far away from the 200-day moving average at $11.55. This negative pressure doesn’t last long and is usually followed by a price explosion. 4. Clear accumulation zone: The price is moving sideways near the bottom, with a massive previous red candle that represents a complete liquidation process.. The whales accumulated, and that was it.
Expected targets:
The first bounce from this zone targets $19 as the first target—this is the key pivot resistance area.
If it breaks through with strong volume, the way opens toward $25 as a second potential target.
Remember: Markets reward patience, and opportunities are made in fear, not in greed.
This is an educational technical analysis, not investment advice. Do your own research and adhere to risk/capital management.
$DEXE #technical_analysis #digital_currencies